
AllegroGraph. AllegroGraph is a closed source triplestore which is designed to store RDF triples, a standard format for Linked Data.[2] AllegroGraph is currently in use in Open source projects,[3] commercial projects[4][5][6][7] and Department of Defense projects.[8] It is also the storage component for the TwitLogic project[9] that is bringing the Semantic Web to Twitter data.[10] Implementation[edit] AllegroGraph was developed to meet W3C standards for the Resource Description Framework, so it is properly considered an RDF Database.
It is a reference implementation for the SPARQL protocol.[11] SPARQL is a standard query language for linked data, serving the same purposes for RDF databases that SQL serves for relational databases.[12] The first version of AllegroGraph was made available at the end of 2004.[14] Languages[edit] See also[edit] Graph database.
Graph databases are part of the NoSQL databases created to address the limitations of the existing relational databases.
While the graph model explicitly lays out the dependencies between nodes of data, the relational model and other NoSQL database models link the data by implicit connections. Graph databases, by design, allow simple and fast retrieval[citation needed] of complex hierarchical structures that are difficult to model[according to whom?] In relational systems. Graph databases are similar to 1970s network model databases in that both represent general graphs, but network-model databases operate at a lower level of abstraction[3] and lack easy traversal over a chain of edges.[4] Graph databases differ from graph compute engines. Background Graph databases, on the other hand, portrays the data as it is viewed conceptually. Create animated graph visualizations with Processing.
Graph visualization is the study of how to turn abstract representations of graphs (think network diagrams of nodes and edges, rather than XY-coordinates) into diagrams. I love graphviz (the program that produced this image), and have used it in several different projects, like this visualization of Senate voting patterns I wrote about in Beautiful Visualization . The chapter describes a series of images that were created from Senate voting data from the 101st session to the 111th session of congress: While graphviz is great, it mainly produces static output, like a PNG. Very useful, but there are limited opportunities for exploration or further development.
In this Answer, I'll show you a Processing sketch that transforms the rather dull output from graphviz into a more interesting, interactive forma that looks like this: The next few sections walk you through the main steps and key things you need to know. Transform into XML Model each Senator with a Vector Related: Network graph with springing example. Many Eyes. Search engine optimization.
As an Internet marketing strategy, SEO considers how search engines work, what people search for, the actual search terms or keywords typed into search engines and which search engines are preferred by their targeted audience.
Optimizing a website may involve editing its content, HTML and associated coding to both increase its relevance to specific keywords and to remove barriers to the indexing activities of search engines. Promoting a site to increase the number of backlinks, or inbound links, is another SEO tactic. The plural of the abbreviation SEO can also refer to "search engine optimizers", those who provide SEO services. History Early versions of search algorithms relied on webmaster-provided information such as the keyword meta tag, or index files in engines like ALIWEB. By relying so much on factors such as keyword density which were exclusively within a webmaster's control, early search engines suffered from abuse and ranking manipulation. Relationship with search engines.
Gephi. Identifying the Pathways for Meaning Circulation using Text Network Analysis. By Dmitry Paranyushkin, Nodus Labs.
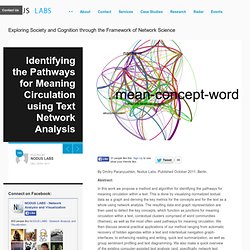
Published October 2011, Berlin. Abstract: In this work we propose a method and algorithm for identifying the pathways for meaning circulation within a text. This is done by visualizing normalized textual data as a graph and deriving the key metrics for the concepts and for the text as a whole using network analysis. The resulting data and graph representation are then used to detect the key concepts, which function as junctions for meaning circulation within a text, contextual clusters comprised of word communities (themes), as well as the most often used pathways for meaning circulation. Keywords: network text analysis, text, network, meaning, narrative, discourse, language understanding, semantics, structure, system, semantic networks, context, cognition, interpretation, graph, diagram, visualization, interface, reading, writing, image Any text can be represented as a network.
“Time prevents everything from being given at once” (Bergson, 2002).