
Data Visualization. DataVisTools. Diagrams & charts tools. KVS: Knowledge Visualization Systems. Add-in for XLS & PPT begraphic.com. Gavurin - Data mapping software. Tableau Software. Tableau Public - free not OSS. Gliffy. OpenHeatMap. 8 useful open source information graphics software. Information graphics are visual representations of information , data or knowledge.
These graphics are mostly used where complex information need a simple explanation, such as in signs, maps, journalism, technical writing, and education. thus tools are mostly use by computer scientists, mathematicians, and statisticians to ease the process of developing and communicating conceptual information. — Wikipedia Here is a list of 8 useful open source information graphics software to create any kind of information graphics.
GeoGebra Geometry diagrams tool GeoGebra is free and multi-platform dynamic mathematics software for all levels of education that joins arithmetic, geometry, algebra and calculus. It offers multiple representations of objects in its graphics, algebra, and spreadsheet views that are all dynamically linked. Tools on Datavisualization. A Carefully Selected List of Recommended Tools 07 May 2012 Tools Flash, JavaScript, Processing, R When I meet with people and talk about our work, I get asked a lot what technology we use to create interactive and dynamic data visualizations.
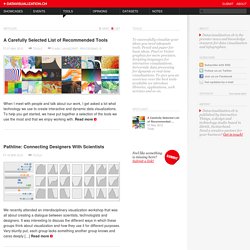
To help you get started, we have put together a selection of the tools we use the most and that we enjoy working with. Read more. Weave, now Open Source. Axiis: Data Vis Framework. Visualisation tools resource list, Anthony Judge and Nadia McLaren — The Nautilus Institute. Visual Understanding Environment.
Software for network dynamics. Java and Flash.