
Base de données. Big Data: A New Approach to Finding Info. A breakthrough method to graphically represent knowledge enables software developers to easily build intelligent agents such as Apple's Siri and IBM Watson.
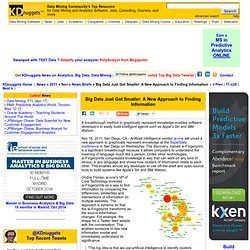
Nov 16, 2011, San Diego, CA - Artificial intelligence vendor ai-one will unveil a new approach to graphically represent knowledge at the SuperData conference in San Diego on Wednesday. The discovery, named ai-Fingerprint, is a significant breakthrough because it allows computers to understand the meaning of language much like a person. Unlike other technologies, ai-Fingerprints compresses knowledge in way that can work on any kind of device, in any language and shows how clusters of information relate to each other.
This enables almost any developer to use off-the-shelf and open-source tools to build systems like Apple's Siri and IBM Watson. "The big idea is that we use artificial intelligence to identify clusters and show how each cluster relates to another," said Florian. Cartographie de l’information : gadget ou outil d’entreprise ? » Les points de même couleur et proches représentent des individus ayant des similarités (lieu de travail, entreprise par exemple) et / ou partageant un ensemble contacts en commun.
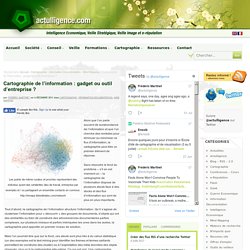
Alors que l’on parle souvent de surabondance de l’information et que l’on cherche des remèdes pour diminuer ou minimiser ce flux d’information, la cartographie peut être un premier élément de réponse. Catalog Dashboard. CKAN – the Open Source Data Portal Software. Data journalism. Data science. We’ve all heard it: according to Hal Varian, statistics is the next sexy job.
Five years ago, in What is Web 2.0, Tim O’Reilly said that “data is the next Intel Inside.” But what does that statement mean? Why do we suddenly care about statistics and about data? In this post, I examine the many sides of data science — the technologies, the companies and the unique skill sets. The web is full of “data-driven apps.” One of the earlier data products on the Web was the CDDB database. Google is a master at creating data products. Google’s breakthrough was realizing that a search engine could use input other than the text on the page. Flu trends Google was able to spot trends in the Swine Flu epidemic roughly two weeks before the Center for Disease Control by analyzing searches that people were making in different regions of the country. Google isn’t the only company that knows how to use data.
In the last few years, there has been an explosion in the amount of data that’s available. Data sources. Données publiques / Open Data. Europe: PublicData.eu. L'opendata. Media Map Shows Impact of Information. (December 5, 2011) How do we know that media make a difference?
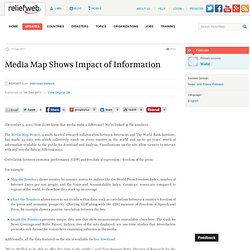
We’ve looked at the numbers. The Media Map Project, a multi-faceted research collaboration between Internews and The World Bank Institute, has made 25 data sets which collectively touch on every country in the world and up to 30 years' worth of information available to the public for download and analysis. Visualizations on the site allow viewers to interact with and test the data in different ways. Correlation between economic performance (GDP) and freedom of expression / freedom of the press For example: Map the Numbers shows country-by-country scores for indices like the World Press Freedom Index, number of Internet Users per 100 people, and the Voice and Accountability Index.
Additionally, all the data featured on the site is available for free download. "We're thrilled to be able to offer this data to the public," said Tara Susman-Peña, Director of Research for the Media Map Project at Internews. National institutes of statistics. Online Data - ESRI. ArcGIS Online Map Services Use these map services to create web maps in ArcGIS Online, or access them directly from ArcGIS for Desktop and ArcGIS for Server.
Open Data. OpenBook. Public Data Explorer. Eurostat, Indicateurs démographiques Eurostat Indicateurs démographiques annuels.

Ce jeu de données a été préparé par Google à partir de données téléchargées depuis le site d'Eurostat. Chômage en Europe (données mensuelles) données sur le chômage harmonisé pour les pays européens. Salaire minimum en Europe Salaire mensuel brut minimum en euros ou parités de pouvoir d'achat, données semi-annuelles. Dette publique en Europe Statistiques sur les finances publiques des pays européens. Public DBs from Washington Post. RPI exports data.gov info. Statistical Data. STATS - MDGs Indicators. Tetherless World. UK government announces open data initiative. UK Open Data Institute (Silicon Roundabout) Posted by Information Age on 28 November 2011 Share article 0googleplus Short of time?
Print this pageEmail article The government will announce a number of open data initiatives tomorrow, including a new Open Data Institute near 'Silicon Roundabout'. The Open Data Institute will "innovate, exploit and research open data opportunities with business and academia", chancellor George Osborne will announce tomorrow. The institute will be directed by leading open data academics Professor Nigel Shadbolt and web inventor Sir Tim Berners-Lee. The scheme recalls the Institute for Web Science, an academic research centre proposed by former prime minister Gordon Brown in March 2010, which was also due to be run by Shadbolt and Berners-Lee. "We want to build on the outstanding work Sir Tim and Nigel Shadbolt have put in to 'making public data public'," said Brown at the time.
However, the current government scrapped the £30 million plan in May 2010, saying it was a "low priority". UK: data.gov.uk. HDR: Human Dev. Reports. US: data.gov. WashPost Databases.