
Lifehacker, tips & downloads 4 getting things done. Bigflowchart2.jpg (Image JPEG, 1024x773 pixels) Ishikawa diagram. Ishikawa diagrams (also called fishbone diagrams, herringbone diagrams, cause-and-effect diagrams, or Fishikawa) are causal diagrams created by Kaoru Ishikawa (1968) that show the causes of a specific event.[1][2] Common uses of the Ishikawa diagram are product design and quality defect prevention, to identify potential factors causing an overall effect.

Each cause or reason for imperfection is a source of variation. Causes are usually grouped into major categories to identify these sources of variation. The categories typically include: Overview[edit] Estimation (gestion de projet) Category:Project management. From Wikipedia, the free encyclopedia Subcategories This category has the following 17 subcategories, out of 17 total. Pages in category "Project management" The following 200 pages are in this category, out of 283 total.
What is gap analysis? Main Page - ScenarioThinking. Holon & co... Bunker Roy: Learning from a barefoot movement. Decision making site that gives advice to help you make smart choices.. Why Intelligent People Fail. What is a Decision Matrix, FREE Template and Example.
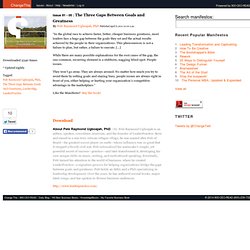
Abaque de Régnier. Un article de Wikipédia, l'encyclopédie libre.
En management et gestion de groupe, un abaque de Régnier est un outil visuel d'aide à la prise de décision facilitant la négociation collective. Inventé en 1973 par François Régnier, docteur en médecine, les premières versions étaient en dur, constituées d'une grille et de cubes dont les six faces étaient colorées. Son informatisation permet un traitement plus rapide des informations. Decision Making Model. Participative decision making : Decision-Making Steps. The Three Gaps Between Goals and Greatness. <A HREF=" Widgets</A> Issue 81 - 05 | The Three Gaps Between Goals and Greatness By Pelè Raymond Ugboajah, PhDPublished April 6, 2011 10:00 a.m.
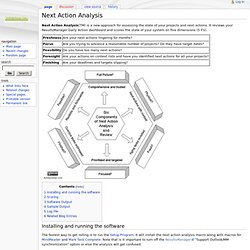
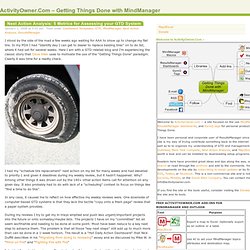
“In the global race to achieve faster, better, cheaper business greatness, most leaders face a huge gap between the goals they set and the actual results achieved by the people in their organizations. This phenomenon is not a failure to plan, but rather, a failure to execute. […] While there are many possible explanations for the root cause of the gap, the one common, recurring element is a stubborn, nagging blind spot: People issues. They won’t go away. Like the Manifesto? Download About Pelè Raymond Ugboajah, PhD | Dr. Request Processed. Next Action Analysis - ActivityOwnerWiki. Next Action Analysis(TM) is a new approach for assessing the state of your projects and next actions.
It reviews your ResultsManager Daily Action dashboard and scores the state of your system on five dimensions (5 F's). Installing and running the software The fastest way to get rolling is to run the Setup Program. It will install the next action analysis macro along with macros for MindReader and Mark Task Complete. Note that is it important to turn off the ResultsManager "Support Outlook/MM synchronization" option or else the analysis will get confused.
Next Action Analysis: 5 Metrics for Assessing your GTD System » ActivityOwner.Com – Getting Things Done with MindManager. I stood by the side of the road a few weeks ago waiting for AAA to show up to change my flat tire.
In my PDA I had "Identify day I can get to dealer to replace balding tires" on to do list, where it had sat for several weeks. Here I am with a GTD-related blog and I'm experiencing the classic story that Dave Allen uses to motivate the use of the "Getting Things Done" paradigm. Clearly it was time for a reality check. I had my "schedule tire replacement" next action on my list for many weeks and had elevated to priority 1 and given it deadlines during my weekly review, but it hadn't happened.
Why? In any case, it caused me to reflect on how effective my weekly reviews were. During my reviews I try to get my in-trays emptied and push less urgent/important projects into the future or onto someday/maybe lists. I decided I needed to review my "trusted system" in a way that get the daily action dashboard de-cluttered and under control. Society for Judgment and Decision Making. The Analysis-Synthesis Bridge Model. Written for Interactions magazine by Hugh Dubberly, Shelley Evenson, and Rick Robinson.
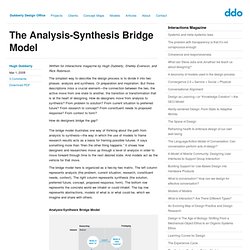
The simplest way to describe the design process is to divide it into two phases: analysis and synthesis. Or preparation and inspiration. But those descriptions miss a crucial element—the connection between the two, the active move from one state to another, the transition or transformation that is at the heart of designing. How do designers move from analysis to synthesis? From problem to solution? How do designers bridge the gap? The bridge model illustrates one way of thinking about the path from analysis to synthesis—the way in which the use of models to frame research results acts as a basis for framing possible futures.
The bridge model here is organized as a two-by-two matrix. Estimation (project management) Estimation (project management) From Wikipedia, the free encyclopedia. Tools for Decision Analysis.
Human Resources Internet Guide. Human Resources - Human Resource Management - HRM - Information Source. AtelierThematiqueVertical.gif (Image GIF, 813x1129 pixels) 37signals: Web-based collaboration apps for small business. Appointment Scheduler Online Reservation Software System. Scheduling Made Easy. Creative Thought Processes. Why Infographics accelerate decision making.jpg. Argument map. A schematic argument map showing a contention (or conclusion), supporting arguments and objections, and an inference objection.
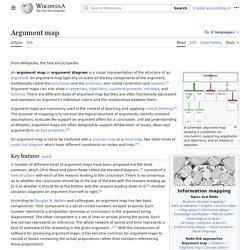
Argument maps are commonly used in the context of teaching and applying critical thinking.[2] The purpose of mapping is to uncover the logical structure of arguments, identify unstated assumptions, evaluate the support an argument offers for a conclusion, and aid understanding of debates. Argument maps are often designed to support deliberation of issues, ideas and arguments in wicked problems.[3] Key features[edit] A number of different kinds of argument map have been proposed but the most common, which Chris Reed and Glenn Rowe called the standard diagram,[5] consists of a tree structure with each of the reasons leading to the conclusion.
According to Doug Walton and colleagues, an argument map has two basic components: "One component is a set of circled numbers arrayed as points. Statements 1 and 2 are dependent premises or co-premises History[edit] Notes[edit] Open-Source Argument Mapping. ABC de la Qualité - cours de qualité de méthodes de résolutions de problèmes et de brainstorming. La qualité se défini comme l'aptitude d’un produit ou d’un service à satisfaire les besoins d’un utilisateur [NF Z67-130].On s'intéresse ici plus spécifiquement à la gestion de la qualité qui est l'ensemble des techniques d'organisation qui concourent à l'obtention de la qualité dans le cadre du pilotage de la production de biens ou de services. Il existe de nombreux outils de gestion de la qualité : PDCA, Pareto, diagramme causes-effets, Six Sigma, 5 pourquoi, AMDEC, Poka Yoké, 5S, QQOQCCP, brainstorming, matrice de compatibilité … On met en œuvre des concepts définis dans la norme ISO 9000 : Responsabilité de la direction, Système Qualité, Revue de contrat, Maîtrise de la conception et des documents, traçabilité, maîtrise des processus, contrôles et essais, gestion des non-conformités, Actions correctives et actions préventives, coûts de non-qualité, Audit interne et Audit de certification.
Vous trouverez ici des cours et formations autour de la qualité. 1. 2. 3. 4. 1. 2. ANALYSER LES ACCIDENTS. Lorsque l'accident survient, il est toujours difficile de garder suffisamment de sang-froid pour en analyser les causes objectives, et prendre des mesures efficaces en conséquence.
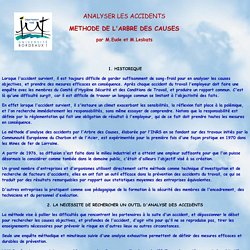
Après chaque accident du travail l'employeur doit faire une enquête avec les membres du Comité d'Hygiène Sécurité et des Conditions de Travail, et produire un rapport commun. C'est là qu'une difficulté surgit, car il est difficile de trouver un langage commun se limitant à l'objectivité des faits. En effet lorsque l'accident survient, il s'instaure un climat exacerbant les sensibilités, la réflexion fait place à la polémique, et l'on recherche immédiatement les responsabilités, sans même essayer de comprendre. Notons que la responsabilité est définie par la réglementation qui fait une obligation de résultat à l'employeur, qui de ce fait doit prendre toutes les mesures en conséquence. Elle vise à ouvrir le dialogue entre: Arbre des causes. Un article de Wikipédia, l'encyclopédie libre.
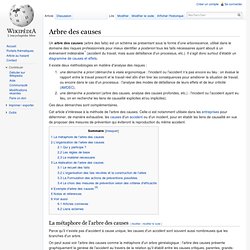
Un arbre des causes (arbre des faits) est un schéma se présentant sous la forme d'une arborescence, utilisé dans le domaine des risques professionnels pour mieux identifier a posteriori tous les faits nécessaires ayant abouti à un évènement indésirable[1] (accident du travail, mais aussi défaillance d'un processus, etc.). Il s'agit donc surtout d'établir un diagramme de causes et effets. Il existe deux méthodologies en matière d'analyse des risques : Ces deux démarches sont complémentaires.
Diagramme de causes et effets. Critical Path Calculator. Diagramme de cause-effets.