
Data visualisation and Infographics tools. Ad Networks. Why the real world is the next big opportunity in big data. Matt Ocko had been investing in data-based companies for years before he and Zack Bogue officially launched Data Collective Venture Capital in 2012.
Since then, the firm has made seed investments in nearly every hot startup in the space, ranging from database companies such as MemSQL to satellite companies such as Planet Labs. This week, Ocko came on the Structure Show podcast to talk about what has him excited as an investor and what’s just overdone. He has interesting opinions on a lot of topics in the tech space, all of which are worth hearing, but here are the highlights from our interview.
If you want to hear more from Ocko, he’ll be speaking at Structure Data (March 18-19 in New York) alongside last week’s podcast guest, Hilary Mason. Infographics. Internet of things. Tellagence. Wahooly. Traackr - Find influencers for your social media marketing. Welcome to TrendSpottr. Appinions. Browse by theme. Create and share visual ideas online. Many Eyes. Bar with negative stack. Data Governance Solution Provider. Facebook report. Big Data Technology - NGData. Data creation is occurring at a record rate.
In 2010, the world generated over 1 Zettabytes of data; by 2014, we will generate 7 ZB a year. While data creation has been growing fast for the last decade, this increase is even more accelerated by the success of electronic, networked devices that have successfully entered both the business and consumer market. Embedded sensors, mobile POS systems, smartphones, tablet computers and many others are now considered an established part of the business landscape.
7 Big Data Players To Watch. The single customer view is dead. Long live the single individual view. Can we really access of all data we have on customers and make decisions on the fly?
Here, I discuss the types of data which is available and describes how the single individual view is emerging as the way forward, not the ever dependant single customer view. Introduction For many years, us marketers have been striving to achieve a utopian state by knowing everything there is to know about our customers. We have even labelled this objective as the “single customer view” but the main challenges organisations have found is:
BI Cloud. Regulation. KPI's. RTB. Personal data – the new oil – Consumer Focus. Liz CollSenior Policy Advocate In the digital economy personal data is a growth business.
The volume of personal data gathered by smart devices, searches, site visits, purchases, recommendations, likes, tweets and status updates is on the rise. Growing too is the value of this data to companies who capture, store, analyse and sell it on. Platfora. Product Overview - Big Data Analytics - Datameer. Integrate, prepare, analyze and visualize any data Datameer simplifies the big data analytics environment into a single application on top of the powerful Hadoop platform.
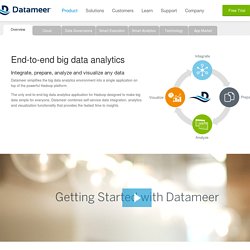
The only end-to-end big data analytics application for Hadoop designed to make big data simple for everyone, Datameer combines self-service data integration, analytics and visualization functionality that provides the fastest time to insights. Data integration Liberate your data Data is the raw materials of insight and the more data you have, the deeper and broader the possible insights. Not just traditional, transaction data but all types of data so that you can get a complete view of your customers, better understand business processes and improve business performance.
Now You See It - ClearStory Data. Clarity From Big Data. Www.stanford.edu/dept/pres-provost/cgi-bin/dg/wordpress/wp-content/uploads/2011/11/StanfordDataGovernanceMaturityModel.pdf. Graph Analytics. Graph Analytics The Graph Analytics Toolkit aims to provide high performance, distributed tools for graph mining, for use in community detection, social network discovery, etc. See the documentation for more details. The toolkit currently implements the following tools: Triangle Counting Two triangle counting program: YarcData. How Does uRiKA Compare to Other Types of Databases? Graphs and Graph Analytics. Address data quality & geocoding for everyone.
Why ElegantJ BI - Business Intelligence Suite - Modern Approach to BI. Get Started with the Industry's #1 Integration Cloud. Startups Offer Tools To Simplify Big Data. Not every big data project has a data scientist on board.
Some startups are developing analysis tools to help non-specialists target the information they need. Researchers at the University of Wisconsin last month announced a tool that combines two high-profile societal trends: a big data analytic that sifts through the 250 million Twitter messages to identify those belonging to school bullies or their victims. The software, which is designed to identify after-the-fact posts from bullies, victims, accusers, or defenders, tags about 15,000 messages per day as related to a specific incident of bullying. The ability to identify specific types of incidents from messages posted by participants outside of school should be valuable to school administrators whose only opportunity for assessing bullying in their schools might be an annual survey and whatever facts they can squeeze out of reticent victims, the researchers said.
Forty Vendors We re Watching: 2012. Products - Visual Analytics. Effective marketing programs require more than simply distributing a message across a variety of digital and conventional channels.
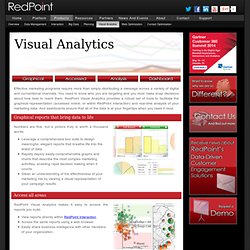
You need to know who you are targeting and you must make snap decisions about how best to reach them. RedPoint Visual Analytics provides a robust set of tools to facilitate the graphical representation (accessed online, or within RedPoint Interaction) and real-time analysis of your marketing data. And dashboards ensure that all of the data is at your fingertips when you need it most.
Numbers are fine, but a picture truly is worth a thousand words. Leverage a comprehensive tool suite to design meaningful, elegant reports that breathe life into the driest of data. RedPoint Visual Analytics makes it easy to access the reports you build. View reports directly within RedPoint Interaction. RedPoint Visual Analytics makes it easy to start high, and then drill into the details of your data.
Keep frequently used reports at your fingertips using dashboards.