
Nagaroad red
EDITEUR. JSONLint - The JSON Validator. SIMILE. Basic Recordset. The Recordset Utility provides a standard way for dealing with a collection of similar objects known as records.
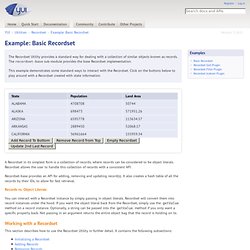
The recordset-base sub-module provides the base Recordset implementation. This example demonstrates some standard ways to interact with the Recordset. Click on the buttons below to play around with a Recordset created with state information. A Recordset in its simplest form is a collection of records, where records can be considered to be object literals. Recordset allows the user to handle this collection of records with a consistent API. Recordset-base provides an API for adding, removing and updating record(s). Timemap - Javascript library to help use a SIMILE timeline with online maps including Google, OpenLayers, and Bing.
Timemap.js is a Javascript library to help use online maps, including Google, OpenLayers, and Bing, with a SIMILE timeline.
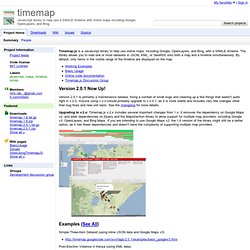
The library allows you to load one or more datasets in JSON, KML, or GeoRSS onto both a map and a timeline simultaneously. By default, only items in the visible range of the timeline are displayed on the map. Zotero. Timeline format. Note: This result format is not currently maintained.
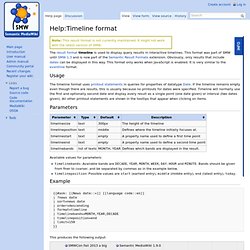
It might not work with the latest version of SMW. The result format timeline is used to display query results in interactive timelines. This format was part of SMW until SMW 1.3 and is now part of the Semantic Result Formats extension. SIMILE Project. Timeline. WP SIMILE Timeline. Timeline JS - Beautifully crafted timelines that are easy, and intuitive to use. jQuery Plugin/Widget. Timeglider JS is a zooming, panning data-driven timeline widget written in Javascript.
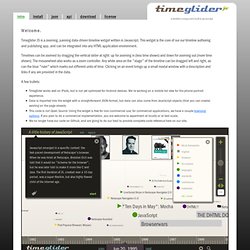
This widget is the core of our our timeline authoring and publishing app, and can be integrated into any HTML application environment. Timelines can be zoomed by dragging the vertical slider at right: up for zooming in (less time shown) and down for zooming out (more time shown). The mousewheel also works as a zoom controller. Any white area on the "stage" of the timeline can be dragged left and right, as can the blue "ruler" which marks out different units of time.
Clicking on an event brings up a small modal window with a description and links if any are provided in the data. VeriteCo/TimelineJS. Data. Get the Data: Data Q&A Forum. Public Data Explorer. Indicateurs internationaux de développement humain - PNUD. DATA-03. FIFA Confederations Cup 2013. RGraph - Free HTML5/JavaScript charts and graphs.
JpGraph - Most powerful PHP-driven charts. Highcharts - Interactive JavaScript charts for your webpage. D3.js - Data-Driven Documents. Edieur codes on line. jQuery.my plugin. FORM-gestion/crea. Gestion-rss. Dropzone.js. Gridster.js. JavaScript Drag and Drop example 3. School timetable is example of how to use REDIPS.drag library.
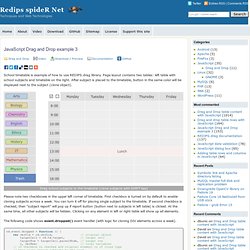
Page layout contains two tables: left table with school subjects and timetable on the right. After subject is placed to the timetable, button in the same color will be displayed next to the subject (clone object). Drag school subjects to the timetable (clone subjects with SHIFT key) Please note two checkboxes in the upper left corner of timetable. First checkbox is turned on by default to enable cloning subjects across a week. The following code shows event.dropped() event handler (with logic for cloning DIV elements across a week). HTML5 Sortable. Download it from here.
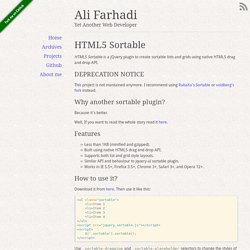
Then use it like this: <ul class="sortable"><li>Item 1 <li>Item 2 <li>Item 3 <li>Item 4 </ul><script src="jquery.sortable.js"></script><script> $('.sortable').sortable(); </script> Use .sortable-dragging and .sortable-placeholder selectors to change the styles of a dragging item and its placeholder respectively. Use sortupdate event if you want to do something when the order changes (e.g. storing the new order): $('.sortable').sortable().bind('sortupdate', function() { }); Use items option to specifiy which items inside the element should be sortable. Use handle option to create sortable lists with handles: Use connectWith option to create connected lists: To remove the sortable functionality completely: $('.sortable').sortable('destroy'); To disable the sortable temporarily: $('.sortable').sortable('disable');
Scroll Effects-CSS3. Scrool-02. Mobiscroll works with multiple javascript frameworks, libraries, MVVM frameworks and datasources.

Including jQuery, jQuery Mobile, Zepto.JS, Kendo UI, Angular.JS, Backbone JS ... and the list goes on. We basically fill the gap of the missing UI controls you were searching for. Packing a whopping 17 highly customizable controls (and the list is growing) including the Date & Time Picker, Select Scroller, Calendar, Range-Picker, Listview, Timer, Timespan Scroller, Treelist Scroller, Color Picker, Image & Text Scroller, Number Picker, Rating & Grading, Temperature, Speed, Distance, Mass and Force Scrollers.
Hint.css - A tooltip library in CSS. Free Web Resources. 21 Attractive and Colorful Chart and Graph Examples. Charts and graphs are often used to give a visual representation of data, especially for publications like Annual Reports or in slide and Powerpoint presentations.

Through graphs, you can easily provide your readers or viewers with facts about certain patterns, trends and future outcomes. Also, most people find it easier to understand and analyze data and figures when plotted into charts and graphs such as pie graphs, line charts, bar graphs, among others. In this post therefore, we put together 21 very attractive and visually appealing charts and graphs examples that you can use as inspiration in creating your own data visualization. The examples include pie charts, bar graphs, infographics and a few tutorials that you can follow in case you have no idea how to come up with your own charts.
To know more about each graph or chart and view it in larger format, simply follow the link provided below each preview image. Dynamic Drive-code library.