
NodeXL: Network Overview, Discovery and Exploration for Excel. SocialAction. SocialAction is a social network analysis tool that integrates visualization and statistics to improve the analytical process.
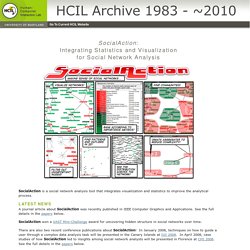
A journal article about SocialAction was recently published in IEEE Computer Graphics and Applications. See the full details in the papers below. SocialAction won a VAST Mini-Challenge award for uncovering hidden structure in social networks over time. There are also two recent conference publications about SocialAction! In January 2008, techniques on how to guide a user through a complex data analysis task will be presented in the Canary Islands at IUI 2008. Overview SocialAction aims to help researchers understand their social network data. Although both statistical methods and visualizations have been used by network analysts, exploratory data analysis remains a challenge. Users can For each operation, a stable node layout is maintained in the network visualization so users can make comparisons. Participants SocialAction in Action Academic Publications new! Graphviz.
Génération de graphes avec GraphViz. La production de certaines applications exige de pouvoir générer des graphes au sens recherche opérationelle du terme.
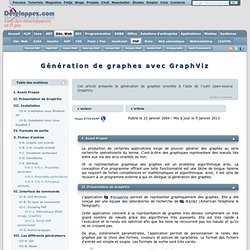
C'est-à-dire des graphiques représentant des noeuds liés entre eux via des arcs orientés ou non. Or la représentation graphique des graphes est un problème algorithmique ardu. La conception d'un programme offrant une telle fonctionnalité est une tâche de longue haleine qui requiert de fortes compétences en mathématiques et algorithmique. Ainsi, il est utile de recourir à un programme externe à qui on délègue la génération des graphes.
L'application GraphViz permet de représenter graphiquement des graphes. AT&T (American Telephone & Telegraph). Cette application convient à la représentation de graphes très denses comprenant un très grand nombre de nœuds grâce des algorithmes très puissants. De plus, entièrement paramétrable, l'application permet de personnaliser le rendu des graphes par le choix des formes, couleurs et polices de caractères. Agrandir cet aperçus... Gephi:Wiki. Gephi, an open source graph visualization and manipulation software. Medusa. What is Medusa? Medusa is a front end (interface) to the STRING protein interaction database. It is also a general graph visualization tool. Why use it? The STRING web interface, while extensive, is static. It does not allow users to create their own networks, enhanced with STRING interactions.
Does it cost anything? Medusa is distributed under the Gnu Public License and costs nothing. Please cite Hooper SD, Bork P. (2005) Medusa: a simple tool for interaction graph analysis. Where do I download it? Just click the link on the left margin. News 2007-01-24 Medusa is now open-source. 2006-11-22 Graph editor added. Parallel Sets. Parallel Sets (ParSets) is a visualization application for categorical data, like census and survey data, inventory, and many other kinds of data that can be summed up in a cross-tabulation. ParSets provide a simple, interactive way to explore and analyze such data. Even though the screenshots here show the Mac version, the program also runs on Windows and Linux. Links to the executables are in the Download Section. Basic Operation To open an existing dataset, select it in the list and either double-click it or click the Open button.
The horizontal bars in the visualization show the absolute frequency of how often each category occurred: in this example, the top line shows the distribution between the passenger classes on the Titanic and the crew. The middle dimension shows a male to female ratio of almost 4 to 1. Between the dimension bars are ribbons that connect categories and split up. Interaction Move your mouse over the display to see the tooltip telling you more about the data. News [Pajek Wiki] Data Visualization Software. SocNetV - Social Networks Visualization and Analysis Software. Analytic Technologies. UCINET Software. UCINET 6 for Windows is a software package for the analysis of social network data.
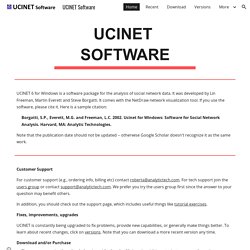
It was developed by Lin Freeman, Martin Everett and Steve Borgatti. It comes with the NetDraw network visualization tool. If you use the software, please cite it. Here is a sample citation: Borgatti, S.P., Everett, M.G. and Freeman, L.C. 2002. Ucinet for Windows: Software for Social Network Analysis. NETDRAW. GGobi data visualization system.