
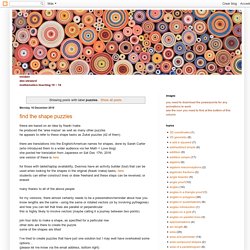
Puzzles. These are based on an idea by Naoki Inaba he produced the 'area mazes' as well as many other puzzles he appears to refer to these shape tasks as Zukei puzzles (42 of them) there are translations into the English/American names for shapes, done by Sarah Carter (who introduced them to a wider audience via her Math = Love blog) she posted her translation from Japanese on Sat Dec 17th, 2016 one version of these is here for those with tablet/laptop availability, Desmos have an activity builder (tool) that can be used when looking for the shapes in the original (Naoki Inaba) tasks, here students can either construct lines or draw freehand and these steps can be reversed, or erased many thanks to all of the above people.
Tasks Archive. How We Serve Data at Verdens Gang. News journalism is about bringing new information to the reader as quickly as possible.
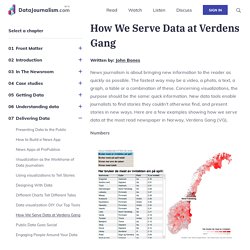
The fastest way may be a video, a photo, a text, a graph, a table or a combination of these. Concerning visualizations, the purpose should be the same: quick information. New data tools enable journalists to find stories they couldn’t otherwise find, and present stories in new ways. Here are a few examples showing how we serve data at the most read newspaper in Norway, Verdens Gang (VG).
Numbers This story is based on data from the Norwegian Bureau of Statistics, taxpayers data and data from the national Lotto monopolist. Networks We used social network analysis to analyze the relations between 157 sons and daughters of the richest people in Norway. Maps In this animated heatmap combined with a simple bar chart you can watch see crime incidents occur on a map of downtown Oslo, hour by hour, over the weekend for several months.
Text Mining Concluding Notes. Staircase to Infinity. Puzzle games - Artful Maths. Masterpieces to Mathematics: Using Art to Teach Fraction, Decimal, and Percent Equivalents. Cambridge Mathematics. Think of a fraction.
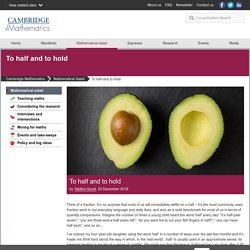
It’s no surprise that most of us will immediately settle on a half – it’s the most commonly used fraction word in our everyday language and daily lives, and acts as a solid benchmark for most of us in terms of quantity comparisons. Imagine the number of times a young child hears the word ‘half’ every day: “it’s half-past seven”; “you are three-and-a-half years old”; “do you want me to cut your fish fingers in half?” ; “you can have half each”; and so on… I’ve noticed my four-year-old daughter using the word ‘half’ in a number of ways over the last few months and it’s made me think hard about the way in which, in the ‘real world’, ‘half’ is usually used in an approximate sense, its meaning tending to be about a sense of ‘middle’. We might say that the time is “half-past two” any time after 2:25 and before 2:35. But then we enter the world of the mathematics classroom. The trouble with graphs. The trouble with graphs It’s tempting to assume that constructing graphs of data is a relatively straightforward task, requiring students to learn a small set of rules for each type of graph, to be used with a multitude of data sets - in some senses an algorithmic approach.
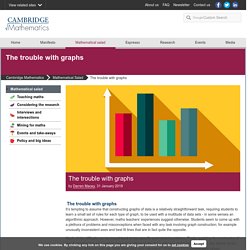
However, maths teachers’ experiences suggest otherwise. Students seem to come up with a plethora of problems and misconceptions when faced with any task involving graph construction; for example unusually inconsistent axes and best fit lines that are in fact quite the opposite. Much of this difficulty can be traced back to two specific and related problems.
La Asignatura de Matemáticas en el Colegio e Instituto. Los programas escolares se elaboran con el objetivo de aportar un conjunto homogéneo y coherente de conocimientos ciclo por ciclo en todas las asignaturas, entre ellas, por supuesto, las matemáticas.
CONTENIDOS ESPECÍFICOS DEL ÁREA DE MATEMÁTICAS - Recursos Primer Ciclo Primaria. Mathematical art lessons - Artful Maths. Así son las clases de Matemáticas de los docentes más innovadores. Muchos estudiantes, desmotivados, no entienden las aplicaciones prácticas que tendrán las Matemáticas en su vida, y su estudio se les hace complicado. Por eso, los docentes innovadores apuestan por enfocar esta asignatura de una manera diferente: recurrir a métodos que impliquen un aprendizaje significativo para el alumnado, explicarles el sentido que tiene esta disciplina en su vida o mezclarlas con música son algunos de sus propuestas. Recopilamos las mejores entrevistas a estos profesores publicadas en nuestra web. Todas ellas transmiten su amor por esta ciencia y por su enseñanza, a la vez que animan a perderles el miedo y disfrutar de ellas.
Yeap Ban Har: “Aprender Matemáticas y divertirse es posible” Interactive clock. Introduction The clock for learning time has movable hands.

It has three main modes, the first demonstrates how to tell the time using an analogue clock. The second mode uses the the clock hands as a way of learning angles. The third mode uses the clock as a way to help understand fractions. The clocked can be altered to change colors and its overall styling. Common Controls The controls above the mode selector are always displayed. The clock can be used to display the current time (based on the clock of the computer you are using). When the clock is not showing the actual real time, then small handles appear at the end of the hands, these and dragged into position.
Time mode controls. Mean, Median & Mode Game for Kids - Fun Math Games Online.