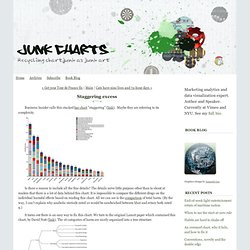

Visual Journalism. Create. Visualize This: The FlowingData Guide to Design, Visualization, and Statistics. Staggering excess. Business Insider calls this stacked bar chart "staggering" (link).

Maybe they are referring to its complexity. Is there a reason to include all the fine details? The details serve little purpose other than to shout at readers that there is a lot of data behind this chart. It is impossible to compare the different drugs on the individual harmful effects based on reading this chart. All we can see is the comparison of total harm. It turns out there is an easy way to fix this chart.
Instead of taking data from the right side of this tree, we can take data from the aggregated levels. It's amazing how much more we learn from this chart even though it has less data than the previous one. Similarly, we can plot a chart at the level of physical, psychological, social, etc., and it would still be much more readable than the "staggering" one. Tutorials. Information aesthetics. 50 great examples of infographics - FrancescoMugnai.com. 50 great examples of infographics « FrancescoMugnai.com.
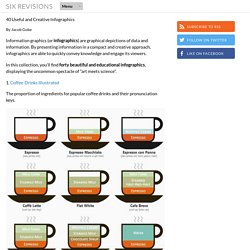
Data Visualization and Statistics. 40 Useful and Creative Infographics. Six Revisions Menu Main Categories CSS HTML JavaScript Web Design WordPress Web Development Design Inspiration UX Design UI Design Freebies Tutorials Tools Links About Contact Advertise RSS Twitter Facebook 40 Useful and Creative Infographics By Jacob Gube Information graphics (or infographics) are graphical depictions of data and information.

In this collection, you’ll find forty beautiful and educational infographics, displaying the uncommon spectacle of "art meets science". 1. The proportion of ingredients for popular coffee drinks and their pronunciation keys. 2. This infographic showcases the history of the Swine Flu, starting from 1976. 3. 4. 5. The top breweries and beers in the U.S. 6. 7. 389 Years Ago A rundown of the historic events in African-American culture. 8. 9. 10. 11. An illustrated guide at how the Global Warming phenomenon works. 13.
A packed visual piece on tobacco chemicals and tobacco trade worldwide. 14. Online Diagram Software and Flowchart Software - Gliffy. 15 Stunning Examples of Data Visualization. Data Visualization is a method of presenting information in a graphical form.

Good data visualization should appear as if it is a work of art. This intrigues the viewer and draws them in so that they can further investigate the data and info that the graphic represents. In this post there are 15 stunning examples of Data Visualization that are true works of art. Click on the title or image for a larger view of each visualization. The Strengths of Nations Here’s an image that discusses the variations in how different nations pursue science. Madrid.Citymurmur CityMurmur tries to understand and visualize how media attention reshapes the urban space and city. Genome Jules & Jim This visual represents the relationship between characters in the movie Jules & Jim. One Week of the Guardian This is one day in a series that takes the news from one week of the Guardian newspaper, and visually represents it as a series of static visualisations.
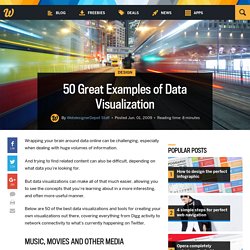
One Week of the Guardian Leisure & Poverty Stock Data Related Posts. 50 Great Examples of Data Visualization. Wrapping your brain around data online can be challenging, especially when dealing with huge volumes of information.

And trying to find related content can also be difficult, depending on what data you’re looking for. But data visualizations can make all of that much easier, allowing you to see the concepts that you’re learning about in a more interesting, and often more useful manner. Below are 50 of the best data visualizations and tools for creating your own visualizations out there, covering everything from Digg activity to network connectivity to what’s currently happening on Twitter. Music, Movies and Other Media Narratives 2.0 visualizes music. Liveplasma is a music and movie visualization app that aims to help you discover other musicians or movies you might enjoy. Tuneglue is another music visualization service. MusicMap is similar to TuneGlue in its interface, but seems slightly more intuitive. Digg, Twitter, Delicious, and Flickr Internet Visualizations.