
40 Essential Tools and Resources to Visualize Data. One of the most frequent questions I get is, "What software do you use to visualize data?
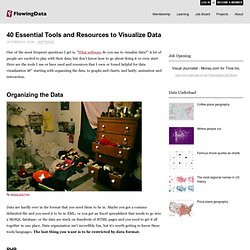
" A lot of people are excited to play with their data, but don't know how to go about doing it or even start. Here are the tools I use or have used and resources that I own or found helpful for data visualization – starting with organizing the data, to graphs and charts, and lastly, animation and interaction. Organizing the Data by sleepy sparrow Data are hardly ever in the format that you need them to be in. PHP was the first scripting language I learned that was well-suited for the Web, so I'm pretty comfortable with it. Python Most computer science types - at least the ones I've worked with - scoff at PHP and opt for Python mostly because Python code is often better structured (as a requirement) and has cooler server-side functions. MySQL When I have a lot of data - like on the magnitude of the tends to hundreds of thousands - I use PHP or Python to stick it in a MySQL database.
Ah, good old R. Vizualize.me: Visualize your resume in one click. The top 20 data visualisation tools. Free Data Visualization Software. Data Visualization and Infographics Examples and Resources.
Things wordy, geeky, and webby Since taking a class that discussed Edward Tufte‘s work, I’ve been fascinated by turning information into visual data.
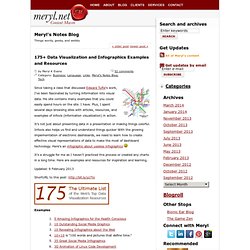
His site contains many examples that you could easily spend hours on the site. I have. Plus, I spent several days browsing sites with articles, resources, and examples of infovis (information visualization) in action. It’s not just about presenting data in a presentation or making things colorful. It’s a struggle for me as I haven’t practiced this process or created any charts in a long time. Updated: 9 February 2013 ShortURL to this post: Examples 5 Amazing Infographics for the Health Conscious10 Outstanding Social Media Graphics10 Revealing Infographics about the Web10×10 is “100 words and pictures that define time.”35 Great Social Media Infographics3D Animation of Linux Code Development7 Nights of Bright Eyes article and accompanying visual analysis of Conor Oberst.AInews.org: Note the .org!
Blogs. 75+ Tools for Visualizing your Data, CSS, Flash, jQuery, PHP. Most people would agree that the old adage “A picture is worth a thousand words” is also true for web based solutions.
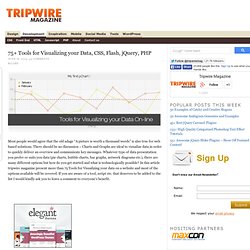
There should be no discussion – Charts and Graphs are ideal to visualize data in order to quickly deliver an overview and communicate key messages. Whatever type of data presentation you prefer or suits you data (pie charts, bubble charts, bar graphs, network diagrams etc.), there are many different options but how do you get started and what is technologically possible? In this article tripwire magazine present more than 75 Tools for Visualizing your data on a website and most of the options available will be covered.
If you are aware of a tool, script etc. that deserves to be added to the list I would kindly ask you to leave a comment to everyone’s benefit. Advertisement Introduction Images says more than a thousands words. The article has been organised into the following sections. Visualisation Tools and Resources. Drawing by numbers organises data visualisation tools under four categories - Charts and graphs; Mapping and mashups; Design, layout and presentation; and Data management tools.
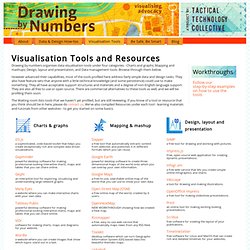
Browse through them below. However advanced their capabilities, most of the tools profiled here address fairly simple data and design tasks. They also have feature sets that anyone with a little technical knowledge (and some persistence) could use to make something. They all have acceptable support structures and materials and a degree of non-English language support. They are also all free to use or open source. Data Visualization. Visual Gadgets. The Best Tools for Visualization. Visualization is a technique to graphically represent sets of data.
When data is large or abstract, visualization can help make the data easier to read or understand. There are visualization tools for search, music, networks, online communities, and almost anything else you can think of. Whether you want a desktop application or a web-based tool, there are many specific tools are available on the web that let you visualize all kinds of data. Here are some of the best: Interactive maps and visualizations.