
TRY. Infografia - A Lista Definitiva. Can you imagine free web hosting service that has 99.9% uptime? Too good to be true? No more! 000webhost.com has made the revolution, forget the stereotype that free hosting is unreliable.. Here is the proof: uptime stats of 20 servers. We beat your paid hosting provider! 1500 MB disk space, 100 GB data transfer! Our free hosting service is supercharged with over 60 features, just like paid hosting. Need unlimited premium hosting that is really UNLIMITED? Signup with www.hosting24.com - unlimited disk space, unlimited data transfer, host unlimited domains for just $4.84 1500 MB Disk Space, 100 GB Data Transfer Every account receives 1500MB space and a whopping 100GB bandwidth, made possible by the unmetered connections our servers utilise.
PHP with MySQL Database Support Unlike other free webhosts we do support PHP and MySQL with no restrictions. cPanel Control Panel cPanel is the most advanced control panel in industry. Fantastico De Luxe 1-Click Autoinstaller Finally! SmARThistory. iF - International Forum Design Hannover: Homepage. Many Eyes. Fleshmap: Studies of Desire. The world as you've never seen it before. Dynamic Diagrams - Visual explanation and information architectu. Information Architects Japan.
Ziba design » home. Phantom High Speed Movie Gallery. The Phantom Miro M-Series cameras have quickly gained adoption in the high-speed imaging market. Whether the customer is a scientist or engineer studying physical phenomena, or an aspiring filmmaker exploring slow-motion as a creative tool, one thing is clear—Phantom Miro cameras are a hit! Now, Vision Research adds the LC-Series to the Phantom Miro camera line. The LC models provide a flip-out, touchscreen that can be used to set up and control the camera as well as provide a video image for framing and focus and for playback of recordings stored in camera memory. The LC models enable users to work in a truly untethered, portable environment. Battery power and CineFlash storage compliment the new LCD touchscreen to provide a complete ecosystem for portable “on the go” shooting. All models of the Miro line—110, 120, 310, and 320S —are available in the LC-Series.
Phantom Miro M / LC110 Product Page Phantom Miro M / LC120 Product Page Phantom Miro M / LC310 Product Page </b>*} TED Conference. We Feel Fine. Alex dragulescu. Supervision. HistoryShots. The Work of Edward Tufte and Graphics Press. Edward Tufte is a statistician and artist, and Professor Emeritus of Political Science, Statistics, and Computer Science at Yale University.
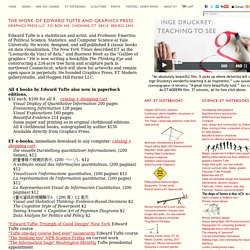
He wrote, designed, and self-published 4 classic books on data visualization. The New York Times described ET as the "Leonardo da Vinci of data," and Business Week as the "Galileo of graphics. " He is now writing a book/film The Thinking Eye and constructing a 234-acre tree farm and sculpture park in northwest Connecticut, which will show his artworks and remain open space in perpetuity. He founded Graphics Press, ET Modern gallery/studio, and Hogpen Hill Farms LLC.
Visual Display of Quantitative Information 200 pages Envisioning Information 128 pages Visual Explanations 160 pages Beautiful Evidence 214 pages Same paper and printing as in original clothbound editions. All 4 clothbound books, autographed by author $150 Available directly from Graphics Press. Die visuelle Darstellung quantitativer Informationen, (200 Seiten), $12 数量情報の視覚的表示, (200 ページ)、$12. Information aesthetics.
IIID Home.