
National Risk Index (NRI) - Identifies Communities Most at Risk to 18 Natural Hazards. The National Risk Index is a new, online mapping application from FEMA that identifies communities most at risk to 18 natural hazards.
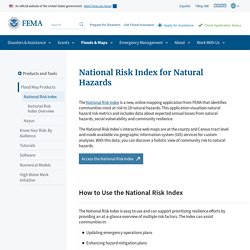
This application visualizes natural hazard risk metrics and includes data about expected annual losses, social vulnerabilities and community resilience. The National Risk Index's interactive web maps are at the county and census tract level and made available via geographic information system (GIS) feature services for custom analyses.
With this data, you can discover a holistic view of community risk to natural hazards via online maps and data. Access the National Risk Index How to Use the National Risk Index (NRI) The National Risk Index (NRI) is easy to use and can support prioritizing resilience efforts by providing an at-a-glance overview of multiple risk factors. Get Started Visit the National Risk Index to understand your risk to natural hazards. Please email us with questions or to share how you are using National Risk Index. Learn More. Cleaner Ports for a Greener World. ND-GAIN Country Index - Summarizes a Country's Vulnerability to Climate Changes. United States Drought Monitor.
NEWLY ADDED - 2020 Environmental Performance Index. The Environmental Performance Index (EPI) ranks 180 countries on 32 performance indicators across 11 issue categories covering environmental health and ecosystem vitality.
The 2020 EPI features new metrics that gauge waste management, carbon dioxide emissions from land cover change, and black carbon emissions – all important drivers of climate change. Below is a selection of news coverage of this year’s EPI release. For more information and to view complete coverage, go to the EPI website at epi.yale.edu.
What Does Sustainability Look Like? New Global Scorecard Will Offer a Glimpse On June 4, the 2020 Environmental Performance Index (EPI) will issue its 12th biennial ranking of 180 countries on how they are performing in terms of environmental health and ecosystem vitality. NRCS National Water and Climate Center. Tropical Storm Risk (TSR) for long-range forecasts of hurricane, typhoon and cyclone worldwide. Climate Change Performance Index. Waffle House Index - What do Waffle Houses Have to Do with Risk Management? What do Waffle Houses have to do with risk and disaster management?
As anyone who has heard Administrator Fugate speak once or twice knows, more than you might think. During his days as the head of Florida’s Department of Emergency Management, Craig began to use a simple test to determine how quickly a community might be able to get up and running again after a disaster: The Waffle House test. If this comparison seems odd at first, think again. Yesterday, EHS Today, a magazine for environment, health and safety leaders, explained that major companies such as The Home Depot, Walmart, and Waffle House serve as role models in disaster preparedness.
They’ve taken necessary steps to prepare. If a Waffle House store is open and offering a full menu, the index is green. As Craig often says, the Waffle House test doesn’t just tell us how quickly a business might rebound – it also tells us how the larger community is faring. Index Map of Recent Earthquakes in California-Nevada. Announcement of Creation of Climate Change Variability/Vulnerability Index.
COLLEGE PARK, Md. – Last year a series of severe weather events including the late-winter storm that hit the U.S.
Northeast, followed by weather-related damage that closed the U.S. -Mexico Laredo border, and subsequent U.S. landfall hurricanes Harvey, Irma and Maria contributed to a doubling of global supply chain disruption and, for the first time, made the United States the region most-impacted by such disruption. These impacts, highlighted in a recent report, form part of the impetus for a new partnership between the University of Maryland and software firm Reslinc.
Researchers in UMD’s Earth Systems Science Interdisciplinary Center (ESSIC) and in the Supply Chain Management Center of the Robert H. Smith School of Business have begun work on a prototype of a highly localized “Climate Change Variability/Vulnerability Index.” “Climate change varies greatly by location. The need for this new index is underscored by the November 23rd release of a new U.S. Global Flood Map. U.S. Drought Risk Atlas. Oil-Climate Index — Carnegie Endowment for International Peace. Corporate Clean Energy Procurement Index. The Corporate Clean Energy Procurement Index, written by Clean Edge on behalf of the Retail Industry Leaders Association (RILA) and Information Technology Industry Council (ITI), ranks all 50 U.S. states on the ease with which America’s most recognizable brands can procure domestic renewable energy such as solar or wind for their operations.

Retail and tech companies such as Amazon, Apple, Facebook, Google, Microsoft, Target and Walmart are among nearly half of the Fortune 500 companies seeking to locate operations in states with ready access to clean-energy sources. While created on behalf of RILA and ITI, the index is broadly applicable to many stakeholders, including other business sectors, the military, higher education, and state and local government.
It is intended to assist policymakers and large RE buyers in advancing policies that help, not hinder, RE development, and help large RE buyers to select states in which they may make RE investments. Overall Results Report Partners.