
10 Fun Tools To Easily Make Your Own Infographics. People love to learn by examining visual representations of data. That’s been proven time and time again by the popularity of both infographics and Pinterest. So what if you could make your own infographics ? What would you make it of? It’s actually easier than you think… even if you have zero design skills whatsoever. Below are my two favorite infographic-making web 2.0 tools that I highly recommend. Click the name of each tool to learn more! Visual.ly One of the more popular ways to discover infographics, Visual.ly actually just launched a design overhaul of their website.
Dipity Want to get a beautifully simply visualization of data over time? Easel.ly I absolutely love Easel.ly. Venngage Venngage (likely named for Venn diagrams) is a double threat. Infogr.am One of the most simple tools, Infogr.am lets you actually import data right into the site and then translate it all into useful visualizations. Tableau Public Photo Stats This one’s an iPhone app that’s worth trying out. What About Me? How to Create an Awesome Infographic [INFOGRAPHIC] There's no better way to show companies how to create an engaging infographic than through outlined steps in the form of an infographic.
![How to Create an Awesome Infographic [INFOGRAPHIC]](http://cdn.pearltrees.com/s/pic/th/how-create-awesome-infographic-33935855)
A new infographic by Infographic Labs — first published by Performancing.com — highlights the best practices of developing a creative way to get the word out about new data. As the amount of information we consume on the Internet grows and attention spans decrease thanks to a bevvy of distractions from email to Facebook, market research firms and other companies are packaging new data in visual ways. In some cases, infographics even go viral.
SEE ALSO: 20 Reasons to Switch to Google+ [INFOGRAPHIC] From how to pick color schemes and graphics to approaching layout, this infographic gives you a rundown on how to best get your information out to others. What do you think makes for a great infographic? Infographic via Infographic Labs. 10 Steps To Designing An Amazing Infographic. Information can be useful—and even beautiful—but only when it’s presented well.

In an age of information overload, any guidance through the clutter comes as a welcome relief. That’s one reason for the recent popularity of information graphics. Infographics are visual designs that help to explain complicated data in a simple way (mental-health emergencies at Burning Man, anyone?). But how are they created? What can we learn from the designer’s process? Over the last decade, Hyperakt has come to specialize in this type of design, and we’ve found a process that works for us. 1. Sifting through data is where it all begins. 2. While it’s tempting to read only the highlighted facts and skim the rest, this shortcut tends to result in more time wasted later. 3. What starts as boring data will become a boring infographic unless a great story can be found. 4. As a story emerges from the data at hand, it’s time to stop for a reality check. The truth in information takes experience to uncover. 10 Awesome Free Tools To Make Infographics.
Advertisement Who can resist a colourful, thoughtful venn diagram anyway?

In terms of blogging success, infographics are far more likely to be shared than your average blog post. Infographics. Infographic Design. 40 Useful and Creative Infographics. Six Revisions Menu Main Categories CSS HTML JavaScript.
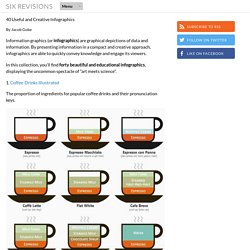
Data Visualization, Information Design and Infographics. Search Results. Whyinfographics1.jpg (JPEG Image, 763 × 1000 pixels) - Scaled (87%)