
Crello 免費的社群行銷圖片線上設計工具,6000+模板免費套用. 多年之前我曾經在電腦玩物介紹過一個好用的線上設計工具:「Canva 日常的設計家:簡報海報、資訊圖表免費製圖」,他內建了許多的模板,可以讓我們「輕鬆套用」,就能快速製作出各種網頁海報、廣告 Banner、 文章主圖 。

而最近我發現另一個跟 Canva 很像的網站,叫做「 Crello 」,同樣是訴求簡單三個步驟就能做出各種社群行銷圖片:套用設計模板、插入素材、簡單調整。 而且不知道是不是「 Crello 」推出不久的關係,目前他提供的 6000+ 設計模板看起來都可以免費套用。 並且免費的「 Crello 」帳戶設計完成後,還是可以下載各種解析度的圖片,圖片上也不會壓上浮水印(以目前這篇文章發布時所測試的結果來說)。 這篇文章的前因後果: 「前因」:其實這類線上設計工具很多,功能也大同小異,我之前還在電腦玩物整理了「社群小編與部落格站長的圖片行銷必備10大免費工具」一文,而這篇文章又多介紹一個「 Crello 」的原因,正是因為他「目前」有大量高品質的免費設計樣板可以直接套用。 「後果」:需要更多免費設計資源的朋友,推薦參考我的另外一篇總整理:「設計師懶人包:90+免費設計工具與免費設計資源總目錄整理」。 我們可以用 Google 或 Facebook 帳號註冊登入「 Crello 」,在設計首頁上,可以選擇我們需要設計的行銷圖片尺寸,然後開始進入設計流程。 不懂程式也可以做出漂亮的動態資訊圖表,台灣新創 PlotDB 免費給你上百種華麗選項. 無論是個上班族還是學生,你一定會有很多需要用到圖表的時候。
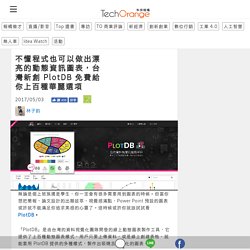
但當你想把簡報、論文設計的出類拔萃、視覺感滿點,Power Point 預設的圖表或許就不能滿足你追求美感的心靈了。 這時候或許你就該試試看 PlotDB。 「PlotDB」是由台灣的資料視覺化團隊開發的線上動態圖表製作工具,它提供了上百種動態圖表樣式,用戶只要上傳資料,或是線上創建表格,就能套用 PlotDB 提供的多種樣式,製作出吸睛且多樣化的圖表。 以下我們就以 2016 年的手機市占率來做一個示範報表給大家參考。 1. 為了呈現 PlotDB 的新潮,我們就選中間的那個圖表吧! 2. 進來之後你就會看到一個簡單的圖表,左邊是數值列。 3. 經過數值調整之後,這個圖就變成你的形狀了,接著如果你看了覺得配色怪怪的,可以在下面進行調整。 感想:使用上簡單,但統計基礎要夠 PlotDB 裡面的圖表之多樣化,就連做了四年統計報表的我第一時間都有點看不懂每個圖表。 廣告 但同時,他的問題也就是入門並不是那麼容易,如果你是個平常只用長條圖跟圓餅圖打天下的朋友,剛開始切入可能會很痛苦,心理的 OS 一定是:「等等,這個數據又是幹嘛的」。 你對製作這些科技趨勢內容有興趣嗎? 點關鍵字看更多相關文章: Free Infographic Maker. Create Interactive Online Presentations, infographics, animations & banners in. 5 Great Online Tools for Creating Infographics. Professional infographic designers rely primarily on a core vector graphics software program to create their infographics designs.
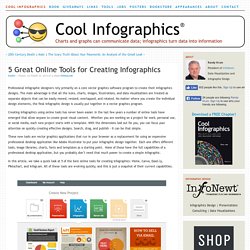
The main advantage is that all the icons, charts, images, illustrations, and data visualizations are treated as separate objects that can be easily moved, resized, overlapped, and rotated. No matter where you create the individual design elements, the final infographic design is usually put together in a vector graphics program. Creating infographics using online tools has never been easier. In the last few years a number of online tools have emerged that allow anyone to create great visual content.
Whether you are working on a project for work, personal use, or social media, each new project starts with a template. These new tools are vector graphics applications that run in your browser as a replacement for using an expensive professional desktop application like Adobe Illustrator to put your infographic design together. 1) Visme (visme.co) Pros: Cons: Pros. 10 free tools for creating infographics. Done right, infographics can be a great way to make sense of complex data.
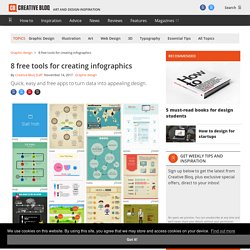
The best infographics transform complex information and data into graphics that are both easy to grasp and visually appealing. 30 Templates & Vector Kits to Design Your Own Infographic. Infographics are always fun to read.
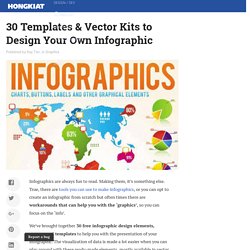
Making them, it’s something else. True, there are tools you can use to make infographics, or you can opt to create an infographic from scratch but often times there are workarounds that can help you with the ‘graphics’, so you can focus on the ‘info’. We’ve brought together 30 free infographic design elements, vectors and templates to help you with the presentation of your infographic. The visualization of data is made a lot easier when you can play around with these ready-made elements, mostly available in vector and Photoshop format. 20+ Tools to Create Your Own Infographics. A picture is worth a thousand words – based on this, infographics would carry hundreds of thousands of words, yet if you let a reader choose between a full-length 1000-word article and an infographic that needs a few scroll-downs, they’d probably prefer absorbing information straight from the infographic.
What’s not to like? Colored charts and illustrations deliver connections better than tables and figures and as users spend time looking back and forth the full infographic, they stay on the site longer. Plus, readers who like what they see are more likely to share visual guides more than articles. Make Beautiful Infographics. How To Create Outstanding Modern Infographics.
In this tutorial you will learn that data doesn't have to be boring, it can be beautiful!

Learn how to use various graph tools, illustration techniques and typography to make an accurate and inspiring infographic in Adobe Illustrator. Start by using the Rectangle Tool (M) to draw a shape. Give it a subtle radial gradient too. The entire design is based on a grid of four columns. To make the columns first select the rectangle and drag a guide onto the centre of the shape. Condense the shape so it fits within the left-most guide and centre guide. Move the shape over to the right and add another guide to the centre here. Using the Rectangle Tool (M) draw a thin white box on the centre line that will be the width of the gap between the columns. Repeat the process for the other columns with your final result being below. I like to place the most important graphics first and work-in the ancillary charts and graphs afterwards. Give the circles a variety of gradients.
That's it! 9 Powerful Free Infographic Tools To Create Your Own Infographics - DATA VISUALIZATION. Turbo Visualization in the Cloud. Create and share visual ideas online. Piktochart : 簡單易學, 支援中文, 可做分頁簡報, 下載與專業版型要付費. Piktochart 範本: 地區年會籌備時程. Piktochart 範本: 38屆年會進場與撤場. Piktochart: 專業版每月$29美金. Piktochart 優缺點. Infogr.am 優缺點. Premium Content Creation for Better Marketing.