
Memento matplotlib. Python Matplotlib Cheat Sheet.
Dessin sous matplotlib. > Modules non standards > Matplotlib > Dessin sous matplotlib Dessin de lignes sous matplotlib : axes.add_artist(matplotlib.lines.Line2D((0, 1), (0, 2), color = 'red')) : trace une ligne en donnant les coordonnées des points extrèmes (x1, x2) et (y1, y2), donc ici entre le point de coordonnées (0, 0) et le point de coordonnées (1, 2).
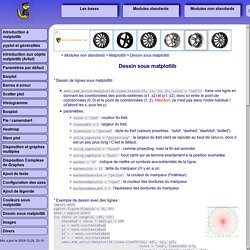
Attention, ce n'est pas dans l'ordre habituel ! Simple Ways to Improve Your Matplotlib. Matplotlib is typically the first data visualization package that Python programmers learn.

While its users can create basic figures with just a few lines of code, these resulting default plots often prove insufficient in both design aesthetics and communicative power. Simple adjustments can lead to dramatic improvements, however, and in this post, I will share several tips on how to upgrade your Matplotlib figures. Tracé de la courbe de f. Init matplotlib. Astéroide matplotlib. Astéroide matplotlib. Fibonacci. Fibo. Fibo. Rectangles. Fct carre. Fonction inverse gestion des exceptions. Inverse gestion des exceptions. Trapèzes. Trapèzes. Rectangles. Rectangles ou trapèzes. Encadrement Rectangles. Approximation Trapèzes.
Fonction indifférence. Vers les Stat et l'échantillonnage. Jupyter Notebook Viewer.