
Welcome to NEAT-Python’s documentation! — NEAT-Python 0.9 documentation. NEAT (NeuroEvolution of Augmenting Topologies) is a method developed by Kenneth O.
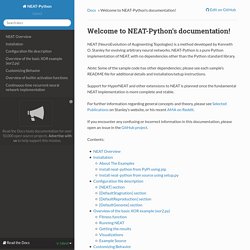
Stanley for evolving arbitrary neural networks. NEAT-Python is a pure Python implementation of NEAT, with no dependencies other than the Python standard library. Note: Some of the sample code has other dependencies; please see each sample’s README file for additional details and installation/setup instructions. Support for HyperNEAT and other extensions to NEAT is planned once the fundamental NEAT implementation is more complete and stable. For further information regarding general concepts and theory, please see Selected Publications on Stanley’s website, or his recent AMA on Reddit. If you encounter any confusing or incorrect information in this documentation, please open an issue in the GitHub project. GitHub - aikorea/awesome-rl: Reinforcement learning resources curated. 25+ websites to find datasets for data science projects.
Open Data. Tools for Decision Analysis. Tools for Decision Analysis:Analysis of Risky Decisions Para mis visitantes del mundo de habla hispana, este sitio se encuentra disponible en español en: Sitio Espejo para América Latina Sitio en los E.E.U.U.Making decisions is certainly the most important task of a manager and it is often a very difficult one.
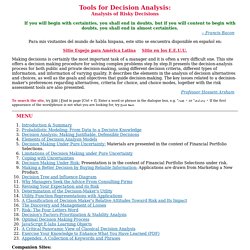
This site offers a decision making procedure for solving complex problems step by step.It presents the decision-analysis process for both public and private decision-making, using different decision criteria, different types of information, and information of varying quality. It describes the elements in the analysis of decision alternatives and choices, as well as the goals and objectives that guide decision-making.
The key issues related to a decision-maker's preferences regarding alternatives, criteria for choice, and choice modes, together with the risk assessment tools are also presented.To search the site, try Edit | Find in page [Ctrl + f]. Introduction to Principal Component Analysis (PCA) - Laura Diane Hamilton. Principal Component Analysis (PCA) is a dimensionality-reduction technique that is often used to transform a high-dimensional dataset into a smaller-dimensional subspace prior to running a machine learning algorithm on the data.

When should you use PCA? It is often helpful to use a dimensionality-reduction technique such as PCA prior to performing machine learning because: Reducing the dimensionality of the dataset reduces the size of the space on which k-nearest-neighbors (kNN) must calculate distance, which improve the performance of kNN. Reducing the dimensionality of the dataset reduces the number of degrees of freedom of the hypothesis, which reduces the risk of overfitting. Most algorithms will run significantly faster if they have fewer dimensions they need to look at. 18 Useful Mobile Apps for Data Scientist / Data Analysts.
Introduction Does your passion lie in Data Science / Analytics ?
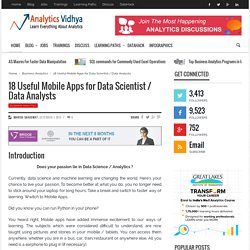
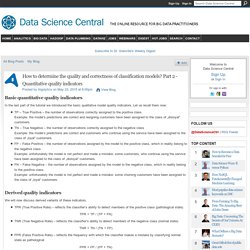
Currently, data science and machine learning are changing the world. Here’s your chance to live your passion. To become better at what you do, you no longer need to stick around your laptop for long hours. Data pre-processing and cleansing. Wzchen/probability_cheatsheet. How to determine the quality and correctness of classification models? Part 2 - Quantitative quality indicators. Basic quantitative quality indicators In the last part of the tutorial we introduced the basic qualitative model quality indicators.
Cheatsheet - Python & R codes for common Machine Learning Algorithms. In his famous book – Think and Grow Rich, Napolean Hill narrates story of Darby, who after digging for a gold vein for a few years walks away from it when he was three feet away from it!
Now, I don’t know whether the story is true or false. But, I surely know of a few Data Darby around me. These people understand the purpose of machine learning, its execution and use just a set 2 – 3 algorithms on whatever problem they are working on. They don’t update themselves with better algorithms or techniques, because they are too tough or they are time consuming. Blog - Ravelin. Over the Summer we were fortunate enough to work with the S2DS 2015 programme.
The goal of the S2DS is to bridge the gap between academia and the workplace for students emerging from PhD studies. Hadoop Applications Gallery. Using Drill with BI Tools Introduction - Apache Drill. Drill Introduction - Apache Drill. Drill is an Apache open-source SQL query engine for Big Data exploration.
Drill is designed from the ground up to support high-performance analysis on the semi-structured and rapidly evolving data coming from modern Big Data applications, while still providing the familiarity and ecosystem of ANSI SQL, the industry-standard query language. Do Faster Data Manipulation using These 7 R Packages. Introduction Data Manipulation is an inevitable phase of predictive modeling.
A robust predictive model can’t be just be built using machine learning algorithms. But, with an approach to understand the business problem, the underlying data, performing required data manipulations and then extracting business insights. Among these several phases of model building, most of the time is usually spent in understanding underlying data and performing required manipulations.
This would also be the focus of this article – packages to perform faster data manipulation in R. 60+ R resources to improve your data skills ( - Software ) This list was originally published as part of the Computerworld Beginner's Guide to R but has since been expanded to also include resources for advanced beginner and intermediate users.
If you're just starting out with R, I recommend first heading to the Beginner's Guide. These websites, videos, blogs, social media/communities, software and books/ebooks can help you do more with R. Books and e-books R Cookbook. Like the rest of the O'Reilly Cookbook series, this one offers how-to "recipes" for doing lots of different tasks, from the basics of R installation and creating simple data objects to generating probabilities, graphics and linear regressions.
R Graphics Cookbook.
Corporate tax revenues falling, putting higher burdens on individuals. Engaging Market Research. Multinomial and ordered logisitic. New Eurostat website - Eurostat. 15 December 2014 The website has been subject to a complete design overhaul to make it more attractive and easier to use, although the overall structure of the website will remain the same. Furthermore, the technological infrastructure supporting the website has been replaced. The data extraction and visualization tools will not change and keep the same functionality. What will change for you: URL changes - please update your bookmarks accordingly- The root URL will change The bulk download URL will change In this Excel file you can find a mapping of the links of the sections between the old and the new website. If you have any questions, please address them to our user support via the "Help" page.
AOL search data leak. Overview[edit] On August 4, 2006, AOL Research, headed by Dr. Abdur Chowdhury, released a compressed text file on one of its websites containing twenty million search keywords for over 650,000 users over a 3-month period, intended for research purposes. AOL deleted the search data on their site by the 7th, but not before it had been mirrored and distributed on the Internet. AOL themselves did not identify users in the report; however, personally identifiable information was present in many of the queries, and as the queries were attributed by AOL to particular user accounts, identified numerically, an individual could be identified and matched to their account and search history by such information.[1] The New York Times was able to locate an individual from the released and anonymized search records by cross referencing them with phonebook listings.[2] Consequently, the ethical implications of using this data for research are under debate.[3][4]
Free Business Statistics, Financial Ratios and Industry Statistics by BizStats. IBM’s Jeff Jonas on Baking Data Privacy into Predictive Analytics. Jeff Jonas of IBM Privacy by Design, an outlook toward software development developed in the 1990s, urges companies to bake privacy protection features into its analytic systems and processes from their conception. While many executives have supported the notion of anonymizing personal data when using it to gain insights into consumer behavior, few have come to personify the evolution of the practice as much as Jeff Jonas, an IBM Fellow and Chief Scientist of the IBM Entity Analytics Group. The 5 Scariest Ways Big Data is Used Today. Bernard Marr Like any information, data – big or small – can be used for good or for ill.
There’s nothing inherently evil about data; it’s what people choose to do with it that can be beneficial or harmful. But big data does have some inherent problems that need to be addressed. The first is privacy. Because we never have been able to collect or analyze data on this scale before, we never have had to come up with rules governing privacy around things like your shopping habits, Internet browsing habits or, if you are using a health tracker, even your walking habits. The second problem is the fact that any set of data is full of hidden biases.
Gartner 2015 Magic Quadrant for Advanced Analytics Platforms: who gained and who lost. SAS, IBM, KNIME, and RapidMiner lead in Gartner 2015 Magic Quadrant for Advanced Analytics Platforms. We analyze who gained and who lost versus last year. By Gregory Piatetsky, @kdnuggets. Gartner, the leading market and technology research firm, has published its 2015 Magic Quadrant for Advanced Analytics Platforms. Gartner 2015 Magic Quadrant for Advanced Analytics Platforms: who gained and who lost. Gartner 2015 Hype Cycle: Big Data is Out, Machine Learning is in. Which are the most hyped technologies today? Check out Gartner's latest 2015 Hype Cycle Report.
HIIK Conflict Barometer 2009. Welcome - IATI Registry. The IATI Standard. Alpha version Please note that the Datastore is currently in its first release. Therefore, data queries may sometimes result in unexpected results. We appreciate your understanding. What is the IATI Datastore? ¶ The IATI Datastore is an online service that gathers all data published to the IATI standard into a single queryable source.
All entries. Pattern. Pattern is a web mining module for the Python programming language. Data pre-processing and cleansing. Datasets. An Interactive Infographic Maps The Future Of Emerging Technology. Can speculation about the future of technology serve as a measuring stick for what we create today? That’s the idea behind Envisioning Technology's massive infographic (PDF), which maps the future of emerging technologies on a loose timeline between now and 2040. Click to enlarge. Professional Online Survey Software & Form Builder.
ROOT a Data analysis Framework. Worldmapper: The world as you've never seen it before. Population Pyramid of WORLD in 2015. Graph-Based Search. Key KPIs for Health Insurance Analytics. - ezdatamunch.com. Increased competition and stringent regulations have created pressure on Health insurance companies to improve their products and enhance their operations. Predictive Analytics in HR - Experfy Insights. Rules For Creating Insightful And Actionable Reports In Metrics. Here is a typical situation during performance reviews: “All the business leaders and stakeholders are present in a room.
Combinatorial Calculator. 7 ways analytics can help Supply Chain. - ezdatamunch.com. There are multiple factors that affect the success of supply chain process. These factors can be divided into four broad categories such as Political, social, economical and technology. Each category encompasses various elements such as increased regulatory pressure, environmental concerns and demand for more sustainable products and efficient processes pertains to political category. Murder Cases, Evidence and Logical Rigor - YOU CANalytics. Aarushi Murder Case & Logical Rigor. Uppsala Conflict Data Program - Uppsala University, Sweden. Forensics. Human Development Index. Application machine learning. Gapminder: Unveiling the beauty of statistics for a fact based world view. Google just got a lot better at understanding questions like an actual person. Financieel-management.
24 Data Science Resources to Keep Your Finger on the Pulse. A programmer’s guide to big data: 12 tools to know — Data. An executive’s guide to machine learning. Analytics with Apache Spark Tutorial Part 2: Spark SQL - DZone Big Data. API : Experts in KPI, Big Data, Enterprise Performance Management. Can You Find Love through Text Analytics? » Loren on the Art of MATLAB. CmapTools. ColorBrewer: Color Advice for Maps. Data Mining. Data Quality Tools - Talend. Data Science. Data Science Cheat Sheet.
The World Bank. Data: Querying, Analyzing and Downloading: The GDELT Project. Elastic · Revealing Insights from Data (Formerly Elasticsearch) Elasticsearch: The Definitive Guide. Hans Rosling: The best stats you've ever seen.
OpenCalais. How to Tell Someone’s Age When All You Know Is Her Name. Interesting Search Engines. IoT Analytics. KAVE. KoBoSync User Guide.
Machine Learning. MapAList - Create and Manage Maps of Address Lists. Newrelic. Open Bank of data. Plotly. Real-Time Analytics In Service of Self-Healing Ecosystems @ Netflix - DZone Cloud. Scaling Market Basket Analysis with MapReduce » Loren on the Art of MATLAB. Simply Statistics. SPARQL is the new King of all Data Scientist’s tools. Tabulator: Generic data browser. TensorFlow - Google’s latest machine learning system, open sourced for everyone. Toolkit13_sec9. Trends. Untitled. Well-formed data. Who will develop psychosis? Automated speech analysis may have the answer. Why Cards are the Future of the Web.
Wimmics is a joint research team between Inria Sophia Antipolis - Méditerranée and I3S (CNRS and Université Nice Sophia Antipolis). Wuala Explorer.