
Flash Floods. Floodwaters at the Confluence of the Wabash and Ohio Rivers. Where the states of Indiana, Illinois, and Kentucky meet, so do the Wabash and Ohio rivers.
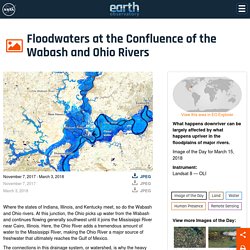
At this junction, the Ohio picks up water from the Wabash and continues flowing generally southwest until it joins the Mississippi River near Cairo, Illinois. Here, the Ohio River adds a tremendous amount of water to the Mississippi River, making the Ohio River a major source of freshwater that ultimately reaches the Gulf of Mexico. The connections in this drainage system, or watershed, is why the heavy rains that spurred flooding in the Midwestern United States in late February 2018 ultimately led to flooding in Louisiana in early March. What happens downriver is largely affected by what happens upriver. Meandering Mississippi River. The winding Mississippi River historically has been used to define many state lines in the United States.
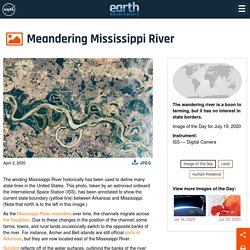
This photo, taken by an astronaut onboard the International Space Station (ISS), has been annotated to show the current state boundary (yellow line) between Arkansas and Mississippi. (Note that north is to the left in this image.) As the Mississippi River meanders over time, the channels migrate across the floodplain. Due to these changes in the position of the channel, some farms, towns, and rural lands occasionally switch to the opposite banks of the river. For instance, Archer and Bell islands are still official parts of Arkansas, but they are now located east of the Mississippi River. Winter Flooding in Mississippi and Louisiana. Persistent heavy rains soaked the Mississippi River watershed in the first two months of 2020.
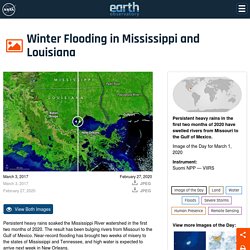
The result has been bulging rivers from Missouri to the Gulf of Mexico. Near-record flooding has brought two weeks of misery to the states of Mississippi and Tennessee, and high water is expected to arrive next week in New Orleans. On February 27, 2020, the Visible Infrared Imaging Radiometer Suite (VIIRS) on the NOAA-NASA Suomi NPP satellite acquired an image showing high water along the lower Mississippi, Pearl, and Pascagoula rivers, among others. The second image shows more typical river conditions as they appeared on March 3, 2017. Both images use a combination of near-infrared and visible light to make it easier to see where rivers are out of their banks and spread across the floodplains.
On February 17, the Pearl River near Jackson, Mississippi, crested at 36.8 feet (11.2 meters), the third highest level on record for the city and the highest since 1983. Water Education Foundation - Everything about California water that matters. Rivers through time, as seen in Landsat images « Hindered Settling. Thanks to the Landsat program and Google Earth Engine, it is possible now to explore how the surface of the Earth has been changing through the last thirty years or so.
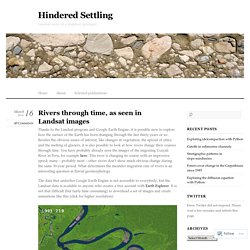
Besides the obvious issues of interest, like changes in vegetation, the spread of cities, and the melting of glaciers, it is also possible to look at how rivers change their courses through time. You have probably already seen the images of the migrating Ucayali River in Peru, for example here. This river is changing its course with an impressive speed; many – probably most – other rivers don’t show much obvious change during the same 30-year period. What determines the meander migration rate of rivers is an interesting question in fluvial geomorphology. The data that underlies Google Earth Engine is not accessible to everybody, but the Landsat data is available to anyone who creates a free account with Earth Explorer. Like this: Like Loading... When the Levee Breaks: Cascading failures in the Sacramento-San Joaquin River Delta, California. Jason R.
Patton, Ph.D., Ross Stein, Ph.D., Volkan Sevilgen, M.Sc. Alluvial Fan in Southern Iran. 13.3 Stream Erosion and Deposition. How streamflow is measured. Part 2: The discharge measurement : USGS Water Science School. CrossSection AFG2013. 19739. Grpg. Click here to see a video about Flood Control on the GRPG!

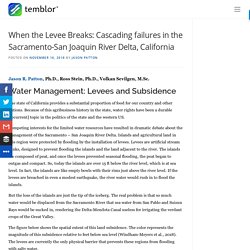
Introduction. Good Habitat Bad Habitat. School Program - Santa Clara Valley Water District. The water district's award-winning school program has reached thousands of young people with educational, interactive lessons on every water topic imaginable.
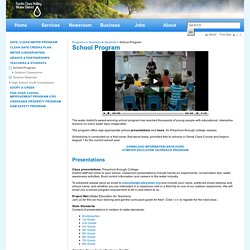
The program offers age-appropriate school presentations and tours for Preschool through college classes. Scheduling is conducted on a first-come, first-serve basis, provided free to schools in Santa Clara County and begins August 1 for the current school year. Flood Protection - Santa Clara Valley Water District. The creeks and rivers that helped form the picturesque Santa Clara Valley are an integral part of the natural beauty of the area.
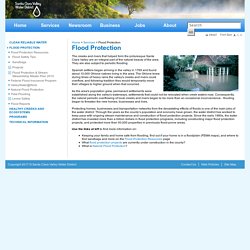
They are also subject to periodic flooding. Teaching Notes. Example Output Example OutputMap and output from FieldScope GIS.
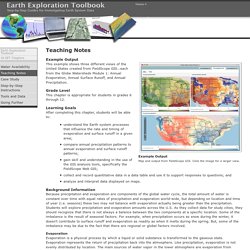
Click the image for a larger view. This example shows three different views of the United States created from FieldScope GIS—each from the Globe Watersheds Module 1: Annual Evaporation, Annual Surface Runoff, and Annual Precipitation. Grade Level This chapter is appropriate for students in grades 6 through 12. Learning Goals After completing this chapter, students will be able to: Flood curves lecture tutorial.v2. Giant Model Mimics Damaged Dam Spillway. Solar paint offers endless energy from water vapor: Compound catalyses splitting of water molecules. Researchers have developed a solar paint that can absorb water vapour and split it to generate hydrogen -- the cleanest source of energy.

The paint contains a newly developed compound that acts like silica gel, which is used in sachets to absorb moisture and keep food, medicines and electronics fresh and dry. But unlike silica gel, the new material, synthetic molybdenum-sulphide, also acts as a semi-conductor and catalyses the splitting of water molecules into hydrogen and oxygen. Lead researcher Dr Torben Daeneke, from RMIT University in Melbourne, Australia, said: "We found that mixing the compound with titanium oxide particles leads to a sunlight-absorbing paint that produces hydrogen fuel from solar energy and moist air. "Titanium oxide is the white pigment that is already commonly used in wall paint, meaning that the simple addition of the new material can convert a brick wall into energy harvesting and fuel production real estate.
Flooding in the Midwest : Image of the Day. Drought Turns to Deluge in California : Natural Hazards. Why Do Rivers Have Deltas? Triple Divide Peak, Montana - EPOD - a service of USRA. Provided by: Tom Kotynski, Great Falls Tribune Summary authors & editors: Rod Benson The peaks shown in the above photo are glacial horns located in Glacier National Park, Montana. These pyramid-shaped features are formed as three or more glaciers erode the sides of a single mountain. NWS JetStream Learning Lesson: Water Cycle Paper Craft. Overview Water moves from the ground to the atmosphere and then returns to the ground, however, the actual path water takes in its cycle is more complicated. There are many stops on water's journey. Students will learn how the water cycle works using 3-D paper craft activity. Procedure. Thompson Canyon FlashFlood(comp) River Systems: Process and Form. Compiled by Jeff Crabaugh at Carleton College (more info) (SERC) and the University of Wyoming This section provides access to a number of visualizations and supporting material that can be used effectively to teach students about physical processes acting in rivers and their floodplains.
Visualizations include simple animations, visual output from numerical models, as well as numerous static illustrations and photos. For more visual resources, browse the complete set of Visualization Collections. Rivers Terrestrial Animations This set of animations from the Community Surface Dynamics Modeling System (CSDMS) group contains 16 movies of various river processes. Earth from Space - Image Information. River Systems: Process and Form. SVS: The Rivers of the Mississippi Watershed. Water Cycle - Earthguide Animated Diagram. Harold Fisk’s Incredible Maps Track the Ghosts of the Mississippi. In 1944, Harold Fisk had been following ghosts for three years. His ghosts were of the meandering Mississippi. A river, big or small, doesn’t stay still – as its waters flow it carves out new paths in a route towards its ultimate destination. Over time, the bends and curves of what seems like a static river snakes into new outlines.
Why Do Rivers Curve? Classroom Activity. Objective To construct a model of a river system with levees. copy of "Overflowing the Banks" student handout (PDF or HTML)A large flat container or tray with sides, such as a wallpaper trayor aluminum baking panA sufficient amount of modeling clay to cover the bottom of the panwatersome spongesdrawing paperpencils St. Louis, Missouri, was protected from serious flood damage because of the walls that were built to hold the river on course even in predicted maximum flooding conditions.
Online Resources for Teaching about Streams and the Water Cycle. Streams Resources. Rivers and Streams - Water and Sediment in Motion.