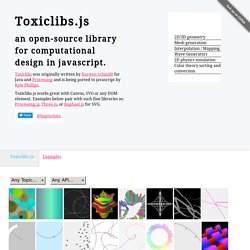

Toxiclibs.js - Open-Source Library for Computational Design. There are several areas where toxiclibs.js stands apart to remain more idiomatic and helpful in the javascript environment.

For a complete description of the conveniences added to toxiclibs.js, read the sugar file in the repository. Some examples of these differences are: loose-typed for working more naturally with javascript objects, no instanceof tests are ever usedtoxi.THREE.ToxiclibsSupport for easing work with Three.jstoxi.color.TColor additions for complete interoperability with CSS and X11 color names.toxi.geom.mesh.OBJWriter's getOutput() for getting OBJ contents back as a string (helpful in js environments that don't have file system access).
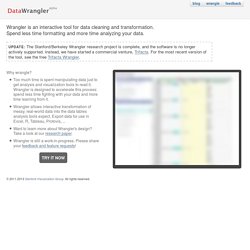
OpenStreetMap. Welcome to the Quantum GIS Project. Word-Cloud Generator 2011/11/01 14:47:57. The R Project for Statistical Computing. Ggplot. had.co.nz. Correlate. Whitepaper. Refine - Google Refine, a power tool for working with messy data (formerly Freebase Gridworks) Data Wrangler. UPDATE: The Stanford/Berkeley Wrangler research project is complete, and the software is no longer actively supported.

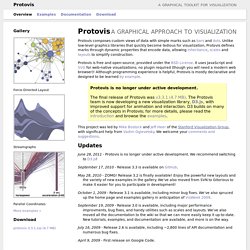
Instead, we have started a commercial venture, Trifacta. For the most recent version of the tool, see the free Trifacta Wrangler. Why wrangle? Too much time is spent manipulating data just to get analysis and visualization tools to read it. TimeFlow Analytical TimelineVisual timelines for investigation - GitHub. Timeline. d3.js. Protovis. Protovis composes custom views of data with simple marks such as bars and dots.

Unlike low-level graphics libraries that quickly become tedious for visualization, Protovis defines marks through dynamic properties that encode data, allowing inheritance, scales and layouts to simplify construction. Protovis is free and open-source, provided under the BSD License. It uses JavaScript and SVG for web-native visualizations; no plugin required (though you will need a modern web browser)! Although programming experience is helpful, Protovis is mostly declarative and designed to be learned by example. Protovis is no longer under active development.The final release of Protovis was v3.3.1 (4.7 MB). Processing.org.
Processing.js. Introduction to Circos, Features and Uses // CIRCOS Circular Genome Data Visualization.