
Tree Diversity in the Brazilian Atlantic Forest: Biases and General Patterns Using Different Sources of Information. Victor P.
ZwienerRenato A. F. de LimaAndrea Sánchez-TapiaDiogo S. Biases in estimation of insect herbivory from herbarium specimens. Effect of sampling protocol on leaf area lost to insects We analysed 248 samples collected from 17 species of woody plants native to the study region.
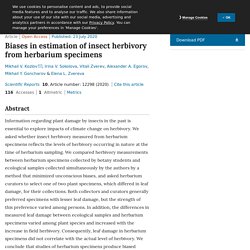
Among these, 85 samples were collected using the protocol developed for ecological research, and 163 samples were collected as herbarium specimens. Each herbarium specimen, on average, contained four-fold fewer leaves than a sample collected by ecological methods (13.5 and 50.3 leaves, respectively). Measurements of leaf area lost to insects were performed by M.V.K., who was aware of research hypothesis and sample origin, and by J.
Rikus, who was blinded to these factors. The average losses of woody plant foliage (Supplementary Data S1) were significantly lower for herbarium specimens (4.87%) than for ecological samples (7.96%), although the differences between these two types of samples varied with the plant species (Table 1, Fig. 1). Preference of press-dried plant specimens by herbarium curators Discussion. Taxonomic bias in biodiversity data and societal preferences. Daru: Sampling Bias. Exploring es50 for GBIF - GBIF Data Blog. It has been suggested that GBIF could make es50 maps similar to what organizations like OBIS are already doing. I decided to make one for land animals (graph above). link to code es50 (Hulbert index) is the statistically expected number of unique species in a random sample of 50 occurrence records, and is an indicator of biodiversity richness.
The score can be computed without random sampling, but the mean of infinite random sampling will produce the same result. Obis Definition here Here I plot a global es50 map for animal genera on GBIF. You might be thinking, why do this strange statistical exercise? Here is the raw genus count map for animals. This a raw animal genus count map of South East Asia shows low-to-medium animal diversity even though this region is a known biodiversity hotspot. Our es50 plot shows most of South East Asia as having medium to high diversity.
Here I plot latitude curves for es50 and genus counts for animal genera. Harvard study illuminates botanical bias. When botanists began collecting plant samples for herbaria more than a century ago, their goal was to catalog and understand the diversity of the natural world.
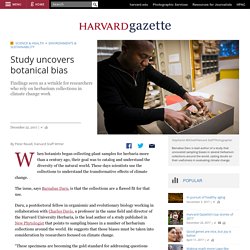
These days scientists use the collections to understand the transformative effects of climate change. The issue, says Barnabas Daru, is that the collections are a flawed fit for that use. Daru, a postdoctoral fellow in organismic and evolutionary biology working in collaboration with Charles Davis, a professor in the same field and director of the Harvard University Herbaria, is the lead author of a study published in New Phytologist that points to sampling biases in a number of herbarium collections around the world. He suggests that those biases must be taken into consideration by researchers focused on climate change. “These specimens are becoming the gold standard for addressing questions related to climate change, ecology, and niche modeling,” Daru said. “Plants are at the beginning of the food chain,” Daru said. Characterisation of false-positive observations in botanical surveys. Introduction Errors in science are inevitable.
Sometimes they are the result of random chance, but also from human fallibility. Errors are particularly common in observations of biodiversity, where organisms can be either inconspicuous, hard to identify or hidden. Furthermore, the process of observation can be disrupted by external influences and observer biases (Simons et al., 2007; Willson, Winne & Todd, 2011).
Animals are often intentionally secretive, but even sedentary organisms, such as plants, are difficult to observe owing to their similarity to each other. While errors in vegetation surveying have been studied from many aspects there are few studies on false-positive errors in botanical recording and few survey schemes have specific quality assurance mechanisms, such as suggested by Scott & Hallam (2003). Users of botanical records expend considerable effort in “cleaning” data (Chapman, 2005). However, there are two potential problems with this approach. Table 1: Taxonomic shortfalls in digitised collections of Australia’s flora. Visualizing natural history collection data provides insight into collection development and bias. Is taxonomic bias in GBIF explained by research focus or societal preferences? Biases. In doing so, the team was able to find some startling biases in these collections.
They broke them down into a handful of categories with the hope that botanists and ecologists can start to improve on these gaps over the coming decades. Although the floras they examined by no means represent anything close to a complete picture of our floristic understanding of the world, they nonetheless mirror issues that are sure to crop up no matter where collections have been made.
The first major category is that of spatial or geographic bias. This occurs whenever specimens are collected at a higher frequency in one place over another. There are likely many reasons for this - ease of access, proximity to research institutions, just to name a few.