
Chapter 1: Location is Where It’s At: Introduction to GIScience and Technology. Printer-friendly version Overview Have you ever found driving directions and maps online, used a smartphone to ‘check in’ to your favorite restaurant, or entered a town name or zip code to retrieve the local weather forecast?
Every time you and millions of other users perform these tasks, you are making use of Geographic Information Science (GIScience) and related spatial technologies. Many of these technologies, such as Global Positioning Systems (GPS) and in-vehicle navigation units, are very well known and you can probably recall the last time you’ve used them. Other applications and services that are the products of GIScience are a little less obvious, but they are every bit as ubiquitous. Simply put, GIScience and the related technologies are everywhere and we use them everyday! Objectives Chapter lead author: Joshua Stevens.
Maps with R. Last month, @freakonometrics posted a bunch of articles on his blog about the North pole (in French): There are some maps on these articles that were produced using ggplot2 excellent package in R.
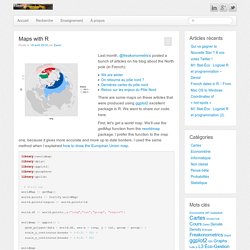
We want to share our code here. First, let’s get a world map. We are winter. Carte impossible ,La by Evelyn Lambart. Prj2EPSG. How We Think About Parking Spaces Is Ruining Our Cities. There's an extremely simple way for cities to generate more revenue, encourage more use of public transit, and cut congestion in the bargain: Raise the price of parking.
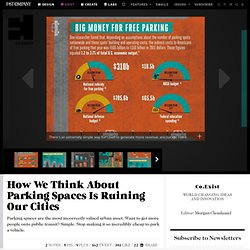
At the moment, many cities keep parking prices and penalties artificially low, and enforce "parking minimum" regulations that require developers to create new spots every time they put up a building. The result is less space for development (which means fewer tax receipts), more environmental and health problems (like asthma), and fewer people using trains and buses, according to a new study. New research from the Drexel University School of Public Health looks at parking price data for 107 U.S. cities.
In 2009, the average cost to park in a central business district was just $1 for two hours. Off-street commuter lots charged an average of $11 a day, with the price often falling at night. But here's the thing. The Drexel study authors aren't the only ones making the case for more expensive parking. Citi Bike, Needing Millions of Dollars, Looks for Help. The Death Knelling Over Citi Bike. In the Wall Street Journal on Thursday, Laura Kusisto, Eliot Brown and Andrew Tangel kick off a report on the challenges facing New York City’s rent-a-bike program with this gripping lead: Leaders of Citi Bike are moving quickly to raise tens of millions of dollars to rescue the popular bike-share program as it loses money, according to people familiar with the matter.
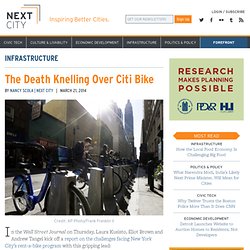
Striking, but given the evidence in the rest of the piece, it has the air of a premature eulogy. Consider how the 10-month-old system has 100,000 annual members. Then there’s the truly terrible winter New York has experienced — Brooklyn data engineer Abe Stanway has proven that Citi Bike weather is indeed a thing — and the fact that the system at rollout had design flaws that seemed almost intended to make sure no one, in the early going, developed a habit of riding Citi Bike. Analyzing Citibike Usage // Abe Stanway. After reading a rogue tweet by dataist-in-chief Chris Wiggins, I figured I’d finally dig into the reams of Citibike usage data I’ve been collecting for the better part of a year.
He claims it’s finally Citibike weather, and to that I say, show me the data! Our data comes from two sources. For Citibike usages, I’ve got a public Graphite instance at data.citibik.es that scrapes Citibike usage every minute, and for temperature, I used Wunderground’s pretty awesome api. Qgis - Time Manage + Twitter in 2013. Current community your communities Sign up or log in to customize your list. more stack exchange communities Stack Exchange sign up log in tour help.
Www.uselessarchaeology.com.
Les ambiances urbaines du Paris Métropole - Blog. Culture et métropolisation La transformation que connaît l’agglomération parisienne s’inscrit dans un processus de métropolisation.
Face aux enjeux et à la concurrence des autres métropoles mondiales, Paris cherche à développer son territoire et réorganiser son espace. La métropolisation « forme un nouveau cadre des pratiques quotidiennes ou habituelles » [Ascher F., 2009]. La culture reste l’un des vecteurs essentiels de cette dynamique. [dumas-00772651, v1] Localisation commerciale et ambiances urbaines : analyse spatiale en Ile-de-France - RABY_Localisation-commerciale-et-ambiances-urbaines.
R & Statistiques - Supports de formation aux statistiques appliquées. Les défis théoriques posés à la cartographie mènent à la cognition. "L'image est non pas une illusion du savoir, au même titre et dans les mêmes proportions qu'elle est une illusion du réel,mais un moyen supplémentaire d'appréhender le réel,un moyen complémentaire de constituer un savoir.
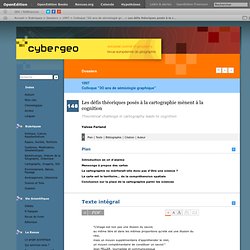
"Jean FELLER, journaliste et communicologue 1Deux phénomènes fondamentaux ont marqué le développement de la cartographie comme discipline scientifique depuis la décennie de 1960. Cependant, plutôt que de se renforcer mutuellement, l’effort théorique consenti envers les finalités de la représentation spatiale a progressé bien plus lentement et faiblement, reléguée dans l’ombre de la révolution technologique des sciences appliquées, laquelle privilégiait les moyens et non les fins.
Data For Decision - part 3 of 3.
Nelle_donnée. Maquette2.pdf - 193-article-5.pdf. The Black Budget: Top secret U.S. intelligence funding - Interactive Graphic - Washington Post. FR:2013 Sudan floods. The future for African elephants - map and analysis. Pointdevue_capgemini_gis_juin2013_0.pdf. OilSpill.pdf (Objet application/pdf) Peut-on fouiller les données des téléphones mobiles en respectant la vie privée. Spaces of Volunteered Geographic Information by Ate Poorthuis, Matthew Zook. Open any recent geography article or book that discusses the internet and you will find the opening sentences replete with the terms ‘new’, ‘change’, ‘proliferation’ and ‘recent’.
Apparently something is brewing in digital space that makes geographers very excited. Clichés aside, it is clear that many of the most recent additions to the online world (e.g.
Prod accès info géo. Topologie. The Nature of Geographic Information. An Open Geospatial Textbook David DiBiase with contributions by James L.
Sloan II, Ryan Baxter, Wesley Stroh, Beth Fletcher King, and many students. Tutoriel QGIS adess. README.md · GitHub. Have: Want: A summary map of polygons representing the area where each neighborhood name is dominant. That is, the area where a given neighborhood name is used more than any other neighborhood name. My approach: Overlay a (hexagonal) grid, and for each cell get all neighborhood polygons overlapping it, then assign to the cell the name that appears most among those polygons. More adventures in overlay: counting overlapping polygons with spaghetti and meatballs. In my last blog post about overlay, I introduced the concept of cartographic spaghetti and how it can be used to split polygons by line features. In this post, I want to continue with the cartographic spaghetti theme by introducing a companion concept: meatballs, which are the centroids of the spaghetti polygons. Map & Globe.
À Jérusalem, l'application GPS Waze fait polémique.