
Tableau Data Blog Finder. Data Visualization. How To Do Keyword Research For Your Site. Part 1: How To Do Keyword Research For Your Site Selecting the right keywords to get visitors to your website is one of the key aspects of Internet marketing.
There are a few basic steps you need to go through when hunting out the keywords you are going to use on your website. Home. Alltop - Top Data Visualization News. Tell a story with data. FiveThirtyEight. Background Image Maps with Tableau. Tableau discovers the world – more detailed maps by using background images and a little trick in Microsoft Excel Tableau Software offers a very easy way of overlaying data on a map, even without requiring the geographical references (latitude and longitude) in the data source.
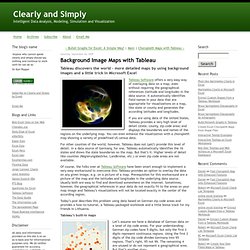
It automatically identifies field names in your data that are appropriate for visualizations on a map, like state or county and generates the according latitudes and longitudes. If you are using data of the United States, Tableau provides a very high level of detail (state, county, zip code area) and displays the boundaries and names of the regions on the underlying map. You can even enhance the visualization with a choropleth map showing a variety of predefined US census data. For other counties of the world, however, Tableau does not (yet?) Tell a story with data. Beautiful Tableau dashboards.