
Assess@Learning Literature Review. How Teachers Evolve Their Formative Assessment Practices When Digital Tools Are Involved in the Classroom. In this section, we present our analysis of three lessons observed during the school year.
Assessment: Why it matters and what you need to know. Assessment: Why it matters and what you need to know. Reforming the Performance Tables - Sig+ for School Data. Eif a4 infographic. Data’s veil of ignorance. A few years back I went for a pizza with an old friend.

We shared a pretty large pizza but somehow ended up with just one slice left between the two of us which we both desperately wanted. Bearing in mind that we would both happily lie, trick or outright fight each other for the last slice, our ensuing discussion about how to apportion it ended in a stalemate, with neither of us agreeing on a compromise. At this point, my friend suggested a solution: I would cut the slice in half, and he would choose which half to take.
Burn your data trackers □ The Ideal Assessment Tracking Regime? In various blog posts and twitter exchanges I have critiqued several widely used approaches to assessment tracking and reporting.
Reasons for my critique include the following: Forcing teachers across very different disciplines to morph their organic, authentic subject specific assessments – including wide-ranging quality and difficulty models – into a common grading system at an excessive number of times determined by the needs of the system, not the teachers.Using measures and scales that give a false impression of being reliable, valid, secure, absolute measures of standards or progress but are actually subjective, arbitrary or even totally spurious.Basing ideas of attainment and progress on an imagined ladder of absolute standards when, usually, all that’s being measured are bell-curve positions within a cohort.
The Level Illusion. Reading Time: Approx 4mins By James Pembroke Back when I worked in a local authority I was asked to build an Excel-based tracking system, something primary schools could use to track pupil progress through levels.

“Pupils make three points per year” I was told. 2018-19_Pre-key_stage_2_-_pupils_working_below_the_national_curriculum_a.._ 'Progress 8 has been blown out of the water' Arm yourself! What if we cannot measure pupil progress? – Becky Allen's musings on education policy. Testing and recording what students know and can do in a subject has always been part of our education system, especially in secondary schools where teachers simply cannot hold in their head accurate information about the hundreds of students they encounter each week.
However, measuring progress – the change in attainment between two points in time – seems to be a rather more recent trend. The system – headteachers, inspectors, advisors – often wants to measure something quite precise: has a child learnt enough in a subject this year, relative to other children who had the same starting point? The talks I have given recently at ResearchED Durrington and Northern Rocks set out why relatively short, standardised tests that are designed to be administered in a 45-minute/one hour lesson are rarely going to be reliable enough to infer much about individual pupil progress.
PUMA Maths Tests For Pupil Assessment. We have developed the following performance indicators to provide you with information about relative performance each term.
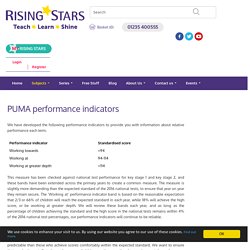
This measure has been checked against national test performance for key stage 1 and key stage 2, and these bands have been extended across the primary years to create a common measure. The measure is slightly more demanding than the expected standard of the 2016 national tests, to ensure that year on year they remain secure. The ‘Working at’ performance indicator band is based on the reasonable expectation that 2/3 or 66% of children will reach the expected standard in each year, while 18% will achieve the high score, or be working at greater depth. We will review these bands each year, and as long as the percentage of children achieving the standard and the high score in the national tests remains within 4% of the 2016 national test percentages, our performance indicators will continue to be reliable.
Standardised and Scaled Scores. Lots of primary schools are now using standardised tests in each year group to help monitor the progress of pupils.
They can be useful for identifying those pupils who seem to have dropped behind their peers, or perhaps aren’t progressing through the curriculum as you might expect based on their prior attainment. However, the fact that standardised scores from such tests look very much like the scaled scores issued for end of Key Stage assessments can cause confusion. If schools are aiming to predict outcomes at the end of Key Stage 2, it doesn’t make sense to treat the two as the same thing. Standardised scores Tests like Rising Stars’ PiRA and PUMA assessments, or the NFER tests, use standardised scores based on a sample of pupils who have taken the test. What next for baseline? In September, around 600,000 four-year-olds will be starting school for the first time – unaware they are at the centre of a maelstrom that is threatening to disrupt primaries for at least the next three years.
Pretty much every one of those children, stepping into school in their as-yet-unscuffed shoes and newly name-tagged jumpers – will be assessed as they arrive. Their teachers will want to know and note, how much they can read, how much they know about numbers, their social skills and their physical ability. It is an essential part of the teachers’ job. We know Amy is struggling. The question is what we do about it. As part of my talk at ResearchEd in Birmingham last weekend, I explored the role of centralised data collection, the ever-present bell curve, the problems with morphing fine-grained ideas about standards and achievement in different subjects into common data formats – all as a pre-amble to examining the limits of ‘can do’ statements.
(That’s a whole other post) The No More Marking Blog. Preparing_for_a_Renaissance_in_assessment. Tracking Grids for Key Objectives. After much discussion in the last week, particularly with experts in the data field, I have tried to adapt the Key Objective spreadsheets put together by Tim Clarke to allow: one document to contain all the tracking for a single class for the core subjectsa quick summary of the numbers/percentage of students meeting the expected standard So far I have put together documents for Years 1 to 6.
Each spreadsheet contains a page for each of Reading, Writing, Maths and Science, with the objectives listed. By entering the names along the top row, teachers can then enter 1, 2 or 3 against each objective to indicate that students are working towards / meeting / exceeding that specific objective. These cells automatically change colour for quick visual representation. In addition, at the foot of the page, a simple summary indicates whether students are working towards, meeting or exceeding the expected level for their age. Downloads Sample documents: Year 5 Tracking Document. RAISEonline is contemptible RUBBISH - Icing on the Cake - An education blog.
The #5MinAfLPlan by @TeacherToolkit and @PivotalPaul. I 2 Votes Sharpen your classroom practice with The 5 Minute AfL Plan from Ross Morrison McGill (@TeacherToolkit) and Paul Dix (@PivotalPaul). Outstanding Assessment for Learning doesn’t happen by chance. Introduction: Our new 5 Minute Plan addresses the finer points of excellent Assessment for Learning; the refinements that cut to the heart of learning and allow you to swiftly plan for fantastic progress.
Learning Ladders – Online Assessment and Target Tracking. One step beyond – assessing what we value. Hey you, don’t teach that. Teach this! Do we always teach what we value? It seems to me that when push comes to shove, we end up teaching what is assessed. The urgency of accountability results, inexorably, in teaching to the test. And this, sadly, ends up with teachers teaching stuff that they don’t particularly value. Does it do what it’s supposed to? Assessing the assessment. In response to a request for constructive criticism of the English assessment model I helped design, Michael Tidd got in touch to query whether it met his 7 questions you should ask about any new ‘post-levels’ assessment scheme. Primary Progression Documents for English & Maths. Planning assessment without levels. The nonsense of the grade descriptors.
This week I have finalised our new Assessment, Marking and Feedback policy and submitted the draft to the Governors for review. This policy was a complete rewrite, incorporating and committing to our latest thinking on assessment without levels and closing the gap marking and feedback. 'We need baseline tests. The problems of accountability won’t be solved by avoiding assessment' Robert Coe, professor in the school of education and director of the Centre for Evaluation and Monitoring (CEM), Durham University, writes: Just say no to junk data: Assessment at Michaela. RS8-Principled-assessment-design-chapter-one. Not As We Know It Limited: Assessment and Curricular Targets Resources. Assessment Journeys.
School Data Updates: The 5 Golden Rules of tracking. As increasing numbers of schools question the effectiveness of their incumbent systems and begin to look at alternatives that may better meet the needs of their curriculum and approach to assessment, it's worth bearing in mind a few golden rules. Hopefully these will provide a suitable fit-for-purpose test and save schools from repeating the mistakes of the past. 1) Separate teacher assessment from performance management Not so much an issue with systems themselves but a mistake that many schools made: using tracking data to set performance management targets.
These would commonly take the form of an annual rate of progress that all pupils were expected to make, or a particular threshold that a certain percentage were expected to be above. Tracking progress001. Itaf changes ks2 blog.