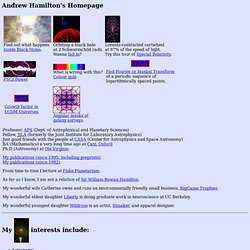

Visual data analysis. Index: Beyond the Third Dimension. Andrew Hamilton's Homepage. Professor, APS (Dept. of Astrophysical and Planetary Sciences) Fellow, JILA (formerly the Joint Institute for Laboratory Astrophysics) Just good friends with the people at CASA (Center for Astrophysics and Space Astronomy) BA (Mathematics) a very long time ago at Catz, Oxford Ph.D (Astronomy) at Ole Virginie.

My publications (since 1995, including preprints).My publications (since 1982). From time to time I lecture at Fiske Planetarium. As far as I know, I am not a relation of Sir William Rowan Hamilton. My wonderful wife Catherine owns and runs an environmentally friendly small business, BigGame Trophies. My wonderful eldest daughter Liberty is doing graduate work in neuroscience at UC Berkeley. My wonderful youngest daughter Wildrose is an artist, filmaker, and apparel designer.
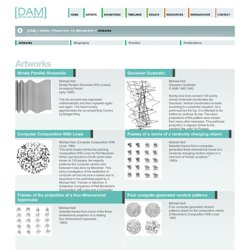
A. Michael Noll. Ninety Parallel Sinusoids Michael Noll Ninety Parallel Sinusoids With Linearly Increasing Period early 1960s The top sinusoid was expressed mathematically and then repeated again and again.

The result closely approximates the op-art painting Current by Bridget Riley. Gaussian Quadratic Michael Noll Gaussian Quadratic © AMN 1965 1962.
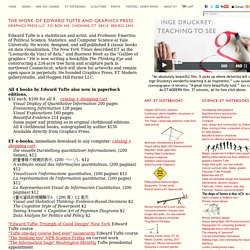
THE PROVING GROUND. Information aesthetics - Data Visualization & Information Design. Processing. Ideas, issues, concepts, subjects - v. Edward Tufte. Edward Tufte is a statistician and artist, and Professor Emeritus of Political Science, Statistics, and Computer Science at Yale University.

He wrote, designed, and self-published 4 classic books on data visualization. The New York Times described ET as the "Leonardo da Vinci of data," and Business Week as the "Galileo of graphics. " He is now writing a book/film The Thinking Eye and constructing a 234-acre tree farm and sculpture park in northwest Connecticut, which will show his artworks and remain open space in perpetuity. He founded Graphics Press, ET Modern gallery/studio, and Hogpen Hill Farms LLC. Visual Display of Quantitative Information 200 pages Envisioning Information 128 pages Visual Explanations 160 pages Beautiful Evidence 214 pages Same paper and printing as in original clothbound editions. All 4 clothbound books, autographed by author $150 Available directly from Graphics Press.
Die visuelle Darstellung quantitativer Informationen, (200 Seiten), $12 数量情報の視覚的表示, (200 ページ)、$12. FlowingData. Ideas, issues, concepts, subjects - v. Information aesthetics. IDV User Experience. Gallery · mbostock/d3 Wiki. Wiki ▸ Gallery Welcome to the D3 gallery!

More examples are available for forking on Observable; see D3’s profile and the visualization collection. Please share your work on Observable, or tweet us a link! Visual Index Basic Charts Techniques, Interaction & Animation Maps Statistics Examples Collections The New York Times visualizations Jerome Cukier Jason Davies Jim Vallandingham Institute for Health Metrics and Evaluation Peter Cook Charts and Chart Components Bar Chart Histogram Pareto Chart Line and Area Chart Pie Chart Scatterplot and Bubble chart Parallel Coordinates, Parallel sets and Sankey Sunburst and Partition layout Force Layout Tree Misc Trees and Graphs Chord Layout (Circular Network) Maps Misc Charts Miscellaneous visualizations Charts using the reusable API Useful snippets Tools Interoperability Online Editors Products Store Apps Presentation Next: A Windows 8 HTML5/SVG Presentation Builder Libraries.