
S Big Data Acquisition Blog: Data Visualization: What is it and Why it Matters? Data visualization refers to the presentation of data in a graphical format. Traditionally, data visualization has existed in the form of charts and maps. The Periodic Table is one of the best uses of data visualization that reveals hidden relationships and makes the classification of chemical elements easy to understand. Visualizations are a means of encoding ideas/messages such that they can be decoded by someone else easily and insights (both obvious and not-so-obvious ones) can be drawn on the data.
Good quality visualizations often reveal some new or fascinating insights upon the underlying data. Such relationships or patterns are usually targeted towards someone who can derive some value out of them. 22 free tools for data visualization and analysis. Review April 20, 2011 06:00 AM ET Computerworld - You may not think you've got much in common with an investigative journalist or an academic medical researcher.
But if you're trying to extract useful information from an ever-increasing inflow of data, you'll likely find visualization useful -- whether it's to show patterns or trends with graphics instead of mountains of text, or to try to explain complex issues to a nontechnical audience. Want to see all the tools at once?
For quick reference, check out our chart listing all the tools profiled here. There are many tools around to help turn data into graphics, but they can carry hefty price tags. Related Blog Here's a rundown of some of the better-known options, many of which were demonstrated at the Computer-Assisted Reporting (CAR) conference last month. Data Visualization Tools. Big Data: 6 Ways To Find What Matters. Big data is poised for a big backlash from business leaders if we can't deliver what matters clearly, in real time.
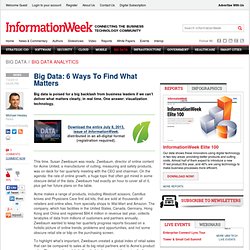
One answer: visualization technology. This time, Susan Zweibaum was ready. Zweibaum, director of online content for Acme United, a manufacturer of cutting, measuring and safety products, was on deck for her quarterly meeting with the CEO and chairman. On the agenda: the rate of online growth, a huge topic that often got mired in some obscure detail of the data.
Zweibaum had exactly an hour to cover all of it, plus get her future plans on the table. Acme makes a range of products, including Westcott scissors, Camillus knives and Physicians Care first aid kits, that are sold at thousands of retailers and online sites, from specialty shops to Wal-Mart and Amazon. The top 20 data visualisation tools. Data visual. Digital Diaries: Buying a Smartphone. 10 Tools for Creating Infographics and Visualizations. The author's posts are entirely his or her own (excluding the unlikely event of hypnosis) and may not always reflect the views of Moz.
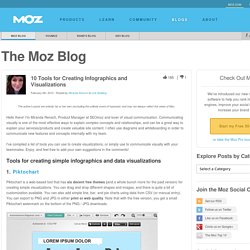
Hello there! I'm Miranda Rensch, Product Manager at SEOmoz and lover of visual communication. Communicating visually is one of the most effective ways to explain complex concepts and relationships, and can be a great way to explain your services/products and create valuable site content. I often use diagrams and whiteboarding in order to communicate new features and concepts internally with my team.
17 Free Awesome Data Visualization Tools: Free Software. 1.

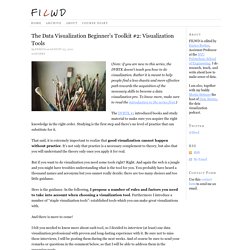
StatPlanet StatPlanet is an easy-to-use, interactive data visualization and mapping software. StatPlanet can be used to create maps, dashboards, charts, and graphs to bring your data to life. In addition to being browser-based, StatPlanet also offers the following downloads for use offline: StatPlanet Map Maker to create fully customizable interactive maps and graphs with the ability to publish them online, StatPlanet World Database to visually explore over 250 development indicators to aid in the understanding of the world, and the Graph Maker to create interactive graphs and charts. 2.
Tableau Public is the free version of Tableau, a commercial data visualization software that enables you to create interactive charts, graphs, maps, and dashboards. 3. Diagramly is an online drawing application that can be used to visualize relationships, organization charts, networks, database schema, and other information. 4. 5. 6. The Data Visualization Beginner’s Toolkit #2: Visualization Tools. (Note: if you are new to this series, the DVBTK doesn’t teach you how to do visualization.
Rather it is meant to help people find a less chaotic and more effective path towards the acquisition of the necessary skills to become a data visualization pro. To know more, make sure to read the introduction to the series first.) The DVBTK #1 introduced books and study material to make sure you acquire the right knowledge in the right order. Studying is the first step and there’s no level of practice that can substitute for it.
That said, it is extremely important to realize that good visualization cannot happen without practice. Infographics & Data Visualization. Many Eyes. Free Data Visualization Software. The 20 best tools for data visualization. It's often said that data is the new world currency, and the web is the exchange bureau through which it's traded.
As consumers, we're positively swimming in data; it's everywhere from labels on food packaging design to World Health Organisation reports. As a result, for the designer it's becoming increasingly difficult to present data in a way that stands out from the mass of competing data streams. Get Adobe Creative Cloud. Your Datasets, Charts, and Reports.