
Statistics. Infographics. Home. Cyoa. As a child of the 80s, the Choose Your Own Adventure books were a fixture of my rainy afternoons.
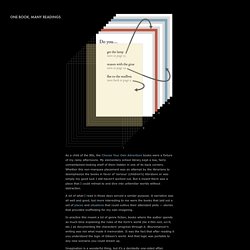
My elementary school library kept a low, fairly unmaintained-looking shelf of them hidden in one of its back corners. Whether this non-marquee placement was an attempt by the librarians to deemphasize the books in favor of ‘serious’ (children’s) literature or was simply my good luck I still haven’t worked out. Homepage. Jeffrey heer. PCD 2/13/09 Heer. Visualization Lab. Enable Your Sales. Skip to main content Languages Main menu english Submitted by admin_biz on Mon, 08/27/2012 - 08:10 Header Home: Slider: Your clients say... Quelle (2009): IDC of all unsuccessful client deals could have been won, if the salesperson had been better informed and had acted more client-oriented. next > Explained Headline: The more you know, the more you sell… Explained Info: Key: Add value on your business content Accelerate your sales Achieve a strategic advantage Five ways BizSphere will help you sell more… Deliver important information to your sales force Find experts in your organization without any effort.
Tasty Data Goodies - Swivel. Create, share, and embed interactive charts online. Many Eyes. Timetric: making sense of statistics. Track-n-Graph - Home. Widgenie - Home. Projects. “Honey, in this business, you've always got to get there the firstest with the mostest and the newest.”
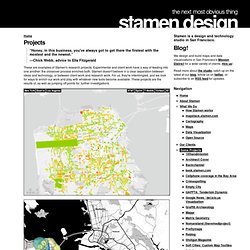
—Chick Webb, advice to Ella Fitzgerald These are examples of Stamen's research projects. Experimental and client work have a way of feeding into one another: the crossover process enriches both. Stamen doesn't believe in a clear separation between ideas and technology, or between client work and research work. For us, they're intermingled, and we look for ways to enrich our work and play with whatever new tools become available. Treemaps for space-constrained visualization of hierarchies. Started Dec. 26th, 1998 by Later updates by Ben Shneiderman and Catherine Plaisant - Last update Sept 2014 Our treemap products: Treemap 4.0: General treemap tool (Free demo version, plus licensing information for full package) PhotoMesa: Zoomable image library browser (Free demo version, plus licensing information for full package) Treemap Algorithms and Algorithm Animations (Open source Java code) A History of Treemap Research at the During 1990, in response to the common problem of a filled hard disk, I became obsessed with the idea of producing a compact visualization of directory tree structures.
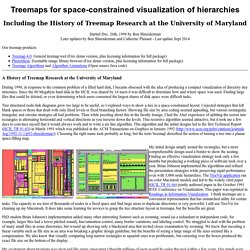
Since the 80 Megabyte hard disk in the HCIL was shared by 14 users it was difficult to determine how and where space was used. Tree structured node-link diagrams grew too large to be useful, so I explored ways to show a tree in a space-constrained layout. My initial design simply nested the rectangles, but a more comprehensible design used a border to show the nesting. Ben Shneiderman. Current Position Professor: Computer Science, UMIACS Founding Director: Human Computer Interaction Lab (1983-2000) Affiliate Professor: Institute for Systems Research Affiliate Professor: College of Information Studies - Maryland's iSchool Research Interests Human-Computer Interaction, User Interface Design, Information Visualization, and Social Media Academic Degree Ph.D., SUNY at Stony Brook, 1973 New Books Recent Honors Short Biography Ben Shneiderman (wikipedia, resume) is a Distinguished University Professor in the Department of Computer Science, Founding Director (1983-2000) of the Human-Computer Interaction Laboratory, and a member of the Institute for Advanced Computer Studies at the University of Maryland, College Park.

He pioneered the highlighted textual link in 1983, and it became part of Hyperties, a precursor to the web. Blog Archive » Information Visualization for Knowledge Discovery. Treemap developed by Jean-Daniel Fekete Ben Schneiderman from the University of Maryland, gave a fascinating talk in Cambridge on 5th March 2009 about the topic of “Information Visualization for Knowledge Discovery.”
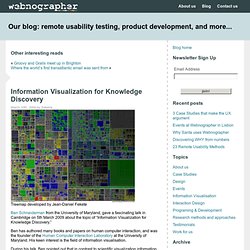
Ben has authored many books and papers on human computer interaction, and was the founder of the Human Computer Interaction Laboratory at the University of Maryland. His keen interest is the field of information visualisation. During his talk, Ben pointed out that in contrast to scientific visualization information visualization is a relatively young field as information visualization conferences have only been going for about 15 years.
jQuery for Designers - Tutorials and. Watch Watch the jQuery spy screencast (alternative flash version) QuickTime version is approximately 60Mb, flash version is streaming.
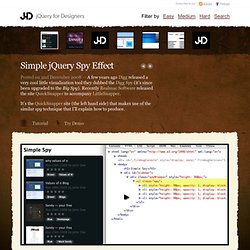
View the demo and source code used in the jQuery spy screencast Simple Spy The great thing about Realmac’s QuickSnapper site is that if JavaScript is turned off, the list of snaps is visible by default. jQuery Sparklines. News 15 June 2013 - Version 2.1.2 Relased This release adds support for jQuery 1.10.0 and other bug fixes and minor improvements.
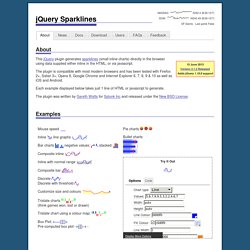
See the full changelog for details of all changes. 26 January 2013 - Version 2.1.1 Relased This release adds support for jQuery 1.9.0 along with a couple of other bug fixes. If you're using a version of jQuery later than 1.8, be extra sure you're not rendering your page in quirks mode to avoid breaking tooltips for IE users. See jQuery's notes on quirks compatiblity for more info.