Protovis
Protovis composes custom views of data with simple marks such as bars and dots. Unlike low-level graphics libraries that quickly become tedious for visualization, Protovis defines marks through dynamic properties that encode data, allowing inheritance, scales and layouts to simplify construction. Protovis is free and open-source, provided under the BSD License. It uses JavaScript and SVG for web-native visualizations; no plugin required (though you will need a modern web browser)! Although programming experience is helpful, Protovis is mostly declarative and designed to be learned by example.
JQuery Charts « Code Blitz
var jsonPieObj = { "pageHits": [['Jan 2009',30], ['Feb 2009',60], ['Mar 2009',22], ['Apr 2009',5], ['May 2009',60], ['June 2009',88], ['Jul 2009',102]], "rssHits": [['Jan 2009',33], ['Feb 2009',45], ['Mar 2009',121], ['Apr 2009',23], ['May 2009',55], ['June 2009',35], ['Jul 2009',77]] }; $(function() {
Overview - CHAP Links Library
CHAP Links Library is a web based visualization library for displaying graphs, networks, and timelines. The tools are developed as Google Visualization Charts for Javascript and GWT. CHAP Links Library is developed by Almende as part of CHAP, the Collective Human Agent Paradigm. This site contains documentation, downloads and live examples of the CHAP Links Library. The Google Group CHAP Links Library can be used to ask questions and share ideas. Sourcecode can be found at the Github project chap-links-library.
10 Open-Source JavaScript Data Chart Libraries Worth Considering
The beauty of modern web design can be found in the widespread advancement of visual and dynamic effects. CSS3 has taken the design world to another level with independent animation properties. But digging even further you’ll notice that open source code has revolutionized the process of creating & using such a code library. There’s no doubt that JavaScript is the king of frontend scripting. It’s a fascinating language to create almost visual effects without any need for backend programming.
Mr.doob's blog
I think it was in 2004 when I started investigating, learning the maths and testing all this stuff of projecting 3d points into a 2d plane... Two years later, in 2006, I had a torus knot with flat shading with a light and a camera. Then Papervision3D came into the scene and I got distracted ;) Two years later, in 2008, I reworked my code with the things I liked from Papervision3D but making it simpler to my mind. At that point I was calling the engine threedoob and I did a bunch of experiments with it.
Update to jQuery Visualize: Accessible Charts with HTML5 from Designing with Progressive Enhancement
Posted by Maggie on 03/12/2010 Topics: accessibility dwpe book jQuery progressive enhancement
10 Javascript frameworks that help you work with canvas - Web development - Backslash
The HTML5 canvas element is becoming even more popular and, while reading some tutorials about it, I realized that there are many javascript frameworks that make it much easier to work with canvas. So here goes the list. Feel free to suggest others that you've seen around. Paper.js Paper.js is an open source vector graphics scripting framework that runs on top of the HTML5 Canvas.
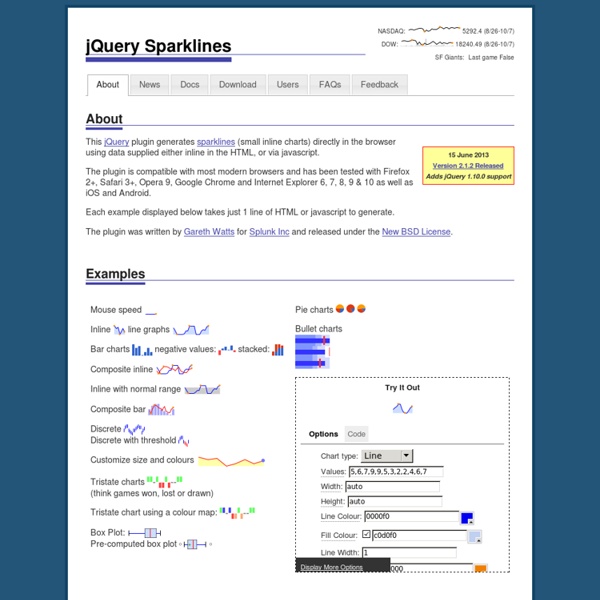
jQuery Sparklines
News 15 June 2013 - Version 2.1.2 Relased This release adds support for jQuery 1.10.0 and other bug fixes and minor improvements. See the full changelog for details of all changes.
Examples
This example demonstrates loading of CSV data, which is then quantized into a diverging color scale. The values are visualized as colored cells per day. Days are arranged into columns by week, then grouped by month and years. Chord diagrams show directed relationships among a group of entities.
Very simple login using Perl, jQuery, Ajax, JSON and MySQL
Introduction Since the beginning of the WWW, the developers try to equip their Web sites with new features and widgets to attract the users' attention and make the life much easier for them by applying the latest technologies. Nowadays, an average Web user, among other activities, shops, searches for information, registers to forums and communities, plays online games and communicates with the other users on the Internet. For most of these activities the user typically needs to register and then log in to the Web site. These basic features require special care; they need to be simple, fast and secure for the user. From the developer's perspective, thanks to the new techniques, the implementation of these features gets easier every day.
Looking 4 data visualization: Software
. IBM, depuis le mois de Mars, dispose d'une nouvelle solution de Business Intelligence: Cognos Insight. Cette solution se positionne principalement sur le marché de la data visualization, IBM espère concurrencer le succès des solutions QlikView, Tableau Software avec la sortie de Cognos Insight . . Pour découvrir Cognos Insight, je vous propose un guest post rédigé par un expert d'IBM: Christoph Papenfuss performance-ideas.com Christoph Papenfuss has been working in the area of Business Analytics and Performance Management for over 14 years.
JQuery
JQuery - Interface to Jquery, a language based on Javascript Version 1.00 JQuery provides some of the functionality provided by the JQuery language. use JQuery; my $jquery = new JQuery(jqueryDir => '/jquery_js') ; my $accordion = JQuery::Accordion->new(id => 'myAccordion', headers => \@headers, texts => \@texts, panelHeight => 200, panelWidth => '400px' ) ; $jquery->add_css_last(new JQuery::CSS( hash => {'#myAccordion' => {width => '600px'}})) ; my $data = [['Id','Total','Ip','Time','US Short Date','US Long Date'], ['66672', '$22.79','172.78.200.124','08:02','12-24-2000','Jul 6, 2006 8:14 AM'], ['66672','$2482.79','172.78.200.124','15:10','12-12-2001','Jan 6, 2006 8:14 AM'] ] ; my $tableHTML = $jquery->Add(JQuery::TableSorter->new(id => 'table1', data => $data, headerClass => 'largeHeaders', dateFormat=>'dd/mm/yyyy' ))->HTML ; $jquery->add($accordion) ; my $html = $accordion->HTML . $tableHTML ; my $jquery_code = $jquery->get_jquery_code ; my $css = $jquery->get_css ; Using JQuery
Comparison « Data Visualization
I got this question often: which is the best Data Visualization product? Lets compare some DV platforms such as Spotfire, Qlikview, Tableau Software and the Microsoft BI platform (PowerPivot, Excel 2010, SQL Server with its VertiPaq, SSAS, SSRS and SSIS). 2 key factors for tool selection are which makes it easy to comprehend the data,price-performance Because modern datasets are huge (or growing very fast!), they are usually best comprehended using Data Visualization (DV) with an ability to interact with data through visual drill-down capabilities and dashboards. There is NO a single best visualization product.