
Calculate Your GPA. How to Calculate Your Grade Point Average (GPA) Your grade point average (GPA) is calculated by dividing the total amount of grade points earned by the total amount of credit hours attempted. Your grade point average may range from 0.0 to a 4.0. For example: A = 4.00 grade points A- = 3.70 grade points B+ = 3.33 grade pointsB = 3.00 grade points B- = 2.70 grade points C+ = 2.30 grade pointsC = 2.00 grade points C- = 1.70 grade points D+ = 1.30 grade pointsD = 1.00 grade points D- = 0.70 grade points WF/F=0 grade points P/NP (Pass/No Pass) courses are not factored in the student's GPA I (Incompletes) and W (Withdrawals) do not receive grade points and do not have an effect on the GPA To get the example student's GPA, the total grade points are divided by the total credit hours attempted.
You can total your current semester courses and credits with our online GPA Calculator (above). To calculate your cumulative G.P.A., total the credit hours and then the grade points from all semesters. Amazing Grade Calculator. EvoTutor - learning through interactive simulation. Human Genetics - Mendelian Inheritance 6. For 1st YEAR STUDENTS veryone has heard of some X-linked recessive disease even though they are, in general, rare.
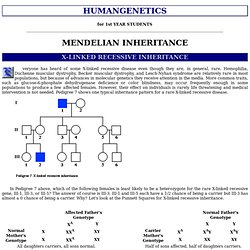
Hemophilia, Duchenne muscular dystrophy, Becker muscular dystrophy, and Lesch-Nyhan syndrome are relatively rare in most populations, but because of advances in molecular genetics they receive attention in the media. More common traits, such as glucose-6-phosphate dehydrogenase deficience or color blindness, may occur frequently enough in some populations to produce a few affected females. However, their effect on individuals is rarely life threatening and medical intervention is not needed. Pedigree 7 shows one typical inheritance pattern for a rare X-linked recessive disease. In Pedigree 7 above, which of the following females is least likely to be a heterozygote for the rare X-linked recessive gene, III-1, III-3, or III-5?
In Pedigree 7, II-2 and II-5 are both carriers, their father was affected and passed on his only X chromosome to his daughters. Evolution - Home. Mark Ridley's Evolution has become the premier undergraduate text in the study of evolution.
Readable and stimulating, yet well balanced and in-depth, this text tells the story of evolution, from the history of the study to the most recent developments in evolutionary theory. The third edition of this successful textbook features updates and extensive new coverage. The sections on adaptation and diversity have been reorganized for improved clarity and flow, and a completely updated section on the evolution of sex and the inclusion of more plant examples have all helped to shape this new edition. Evolution also features strong, balanced coverage of population genetics, and scores of new applied plant and animal examples make this edition even more accessible and engaging.
Dr. Bill Vicars' American Sign Language (ASL) Fingerspelling Practice Site. Diatomic Species by MO theory. Even rather simple molecular orbital (MO) theory can be used to predict which homonuclear diatomic species will exist, explain many properties (why O2 is a paramagnetic diradical), and identify the important frontier molecular orbitals (FMOs).
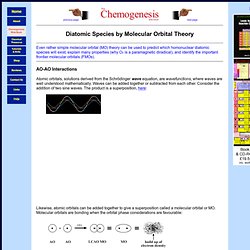
AO-AO Interactions Atomic orbitals, solutions derived from the Schrödinger wave equation, are wavefunctions, where waves are well understood mathematically. Waves can be added together or subtracted from each other. Consider the addition of two sine waves. The product is a superposition, here: Likewise, atomic orbitals can be added together to give a superposition called a molecular orbital or MO. The bonding MO wave function, Ψ (psi), can be squared, |Ψ|2 (psi squared), to represent electron density.
The two positive nuclei are both attracted to the region of electron density and are shielded from each other. The diagram below shows the atomic orbitals, AOs, on a pair of adjacent atoms interacting with each other. Leads to: And so: Dihydrogen Dihelium. Scidiv.bellevuecollege.edu/jm/C150/POGIL/bond order-strength v.2.pdf. Molecular Orbital Theory. Genetic Linkage and Genetic Maps. The Background Gregor Mendel analyzed the pattern of inheritance of seven pairs of contrasting traits in the domestic pea plant.
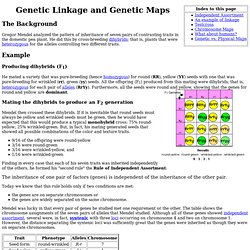
He did this by cross-breeding dihybrids; that is, plants that were heterozygous for the alleles controlling two different traits. Example Producing dihybrids (F1) Three-point testcross - An Introduction to Genetic Analysis - NCBI Bookshelf. A Three-Point Cross. The page Genetic Linkage and Linkage Maps shows how carrying out three different dihybrid test crosses in the corn plant reveals: the order of the gene loci the distance between them (in centimorgans, cM) Here we shall see how a single test cross of a trihybrid corn plant ; that is, one parent is heterozygous for three linked alleles (C,Sh, Bz, on one chromosome; c,sh,bz on the other) and the other parent is homozygous for the recessive version of all three genes (c,c,sh,sh,bz,bz) reveals the gene order and gives a more accurate measurement of the distance in cM separating the outermost loci (in this case C and Bz) than a dihybrid cross involving those loci would.
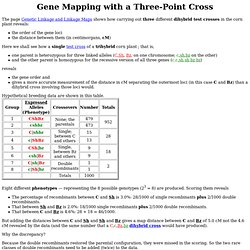
Hypothetical breeding data are shown in this table. Eight different phenotypes — representing the 8 possible genotypes (23 = 8) are produced. Scoring them reveals The percentage of recombinants between C and Sh is 3.0%: 28/1000 of single recombinants plus 2/1000 double recombinants. Why the discrepancy? Three point cross example. Draw a map of these 3 genes (v, w, and z), showing the distances between all pairs of genes, and then calculate the value of interference.
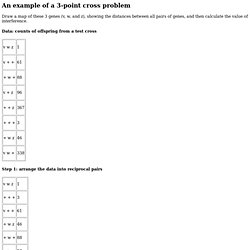
Data: counts of offspring from a test cross Step 1: arrange the data into reciprocal pairs.