
10 outils bluffants pour créer des visuels. 3 outils pour faire des infographies. Avez-vous parfois eu des données à communiquer dans le cadre de votre travail ?
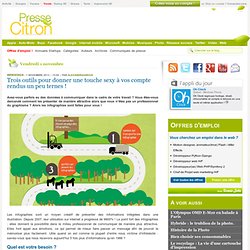
Vous êtes-vous demandé comment les présenter de manière attractive alors que vous n’êtes pas un professionnel du graphisme ? Alors les infographies sont faites pour vous ! Les infographies sont un moyen créatif de présenter des informations intégrées dans une illustration. Depuis 2007, leur utilisation sur internet a progressé de 9900% ! Le point fort des infographies : elles donnent la possibilité dans le milieu professionnel de communiquer de manière plus attractive.
Quel est votre besoin ? Grâce à cet article, vous allez découvrir 3 outils utiles pour faire des infographies. . - Objectif : Quel est votre objectif ? - Message : Quel message voulez-vous faire passer ? - Fil rouge : Quelle ligne directrice allez-vous choisir ? - Focus : Quelle est l’information clé que vous souhaitez mettre en valeur ?
10 outils en ligne pour créer des infographies. Un dessin vaut mieux que de long discours.
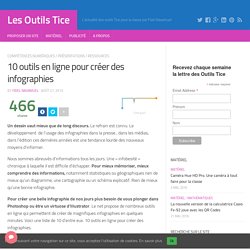
Le refrain est connu. Le développement de l’usage des infographies dans la presse , dans les médias, dans l’édition ces dernières années est une tendance lourde des nouveaux moyens d’informer. Nous sommes abreuvés d’informations tous les jours. Une « infobesité » chronique à laquelle il est difficile d’échapper. Pour mieux mémoriser, mieux comprendre des informations, notamment statistiques ou géographiques rien de mieux qu’un diagramme, une cartographie ou un schéma explicatif. Pour créer une belle infographie de nos jours plus besoin de vous plonger dans Photoshop ou être un virtuose d’Illustrator. Venngage. 3 outils pour faire des infographies qui dépotent !
Infographics. Infographics. People search (social networks) Useful Tools. Pipl - People Search. Create Interactive Online Presentations, infographics, animations & banners in HTML5 - Visme by Easy WebContent. Bunkr: Present Everything. Create and share visual ideas online. How To Create Outstanding Modern Infographics.
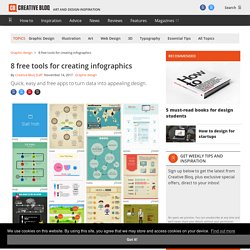
In this tutorial you will learn that data doesn't have to be boring, it can be beautiful!

Learn how to use various graph tools, illustration techniques and typography to make an accurate and inspiring infographic in Adobe Illustrator. Start by using the Rectangle Tool (M) to draw a shape. Give it a subtle radial gradient too. The entire design is based on a grid of four columns. To make the columns first select the rectangle and drag a guide onto the centre of the shape.
Condense the shape so it fits within the left-most guide and centre guide. Move the shape over to the right and add another guide to the centre here. Using the Rectangle Tool (M) draw a thin white box on the centre line that will be the width of the gap between the columns. Repeat the process for the other columns with your final result being below.
I like to place the most important graphics first and work-in the ancillary charts and graphs afterwards. Give the circles a variety of gradients. That's it! Make Beautiful Infographics. Create Easy Infographics, Reports, Presentations. 10 free tools for creating infographics. Done right, infographics can be a great way to make sense of complex data.
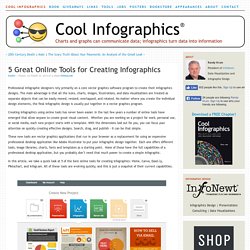
The best infographics transform complex information and data into graphics that are both easy to grasp and visually appealing. The only problem is, infographics that look like they were simple to make are often anything but. Exclusive offer: Save 15% on Adobe Creative Cloud now Here, we've selected our top free tools and apps for making infographics. Some of the options here are even suitable for non-designers, as templates and other features make them easy to use.
Give these free tools a try and let us know which ones you get on best with on Facebook or Twitter. 01. Visme promises to help you 'speak visually'. 02. Canva is a powerful and easy-to-use online tool that's suitable for all manner of design tasks, from brochures to presentations and much more besides. 03. Google's chart tools are powerful, simple to use, and free. 04. 05. Premium Content Creation for Better Marketing. 5 Great Online Tools for Creating Infographics. Professional infographic designers rely primarily on a core vector graphics software program to create their infographics designs.
The main advantage is that all the icons, charts, images, illustrations, and data visualizations are treated as separate objects that can be easily moved, resized, overlapped, and rotated. No matter where you create the individual design elements, the final infographic design is usually put together in a vector graphics program. Creating infographics using online tools has never been easier. In the last few years a number of online tools have emerged that allow anyone to create great visual content.
Whether you are working on a project for work, personal use, or social media, each new project starts with a template. These new tools are vector graphics applications that run in your browser as a replacement for using an expensive professional desktop application like Adobe Illustrator to put your infographic design together. 1) Visme (visme.co) Pros: Cons: Pros. Create Interactive Online Presentations, infographics, animations & banners in. Free Infographic Maker. Create and share visual ideas online. How To Create Outstanding Modern Infographics. How To Create Outstanding Modern Infographics.