
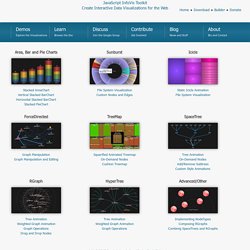
Demos - JavaScript InfoVis Toolkit. JavaScript InfoVis Toolkit Create Interactive Data Visualizations for the Web Home ● Download ● Builder ● Donate Area, Bar and Pie Charts Sunburst.
Data visualisation DIY: our top tools. What data visualisation tools are out there on the web that are easy to use - and free?
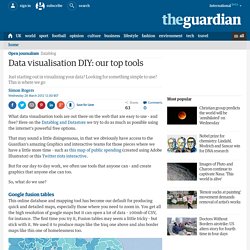
Here on the Datablog and Datastore we try to do as much as possible using the internet's powerful free options. That may sound a little disingenuous, in that we obviously have access to the Guardian's amazing Graphics and interactive teams for those pieces where we have a little more time - such as this map of public spending (created using Adobe Illustrator) or this Twitter riots interactive. RAW. Visual Understanding Environment. Many Eyes. Gephi, an open source graph visualization and manipulation software. Parallel Sets. Parallel Sets (ParSets) is a visualization application for categorical data, like census and survey data, inventory, and many other kinds of data that can be summed up in a cross-tabulation.
ParSets provide a simple, interactive way to explore and analyze such data. Even though the screenshots here show the Mac version, the program also runs on Windows and Linux. Free Data Visualization Software. Dataseed Interactive Data Visualization. D3.js. D3.js (or just D3 for Data-Driven Documents) is a JavaScript library that uses digital data to drive the creation and control of dynamic and interactive graphical forms which run in web browsers. It is a tool for data visualization in W3C-compliant computing, making use of the widely implemented Scalable Vector Graphics (SVG), JavaScript, HTML5, and Cascading Style Sheets (CSS3) standards. It is the successor to the earlier Protovis framework.[2] In contrast to many other libraries, D3 allows great control over the final visual result.[3] Its development was noted in 2011,[4] as version 2.0.0 was released in August 2011.[5] The 36 best tools for data visualization.
It's often said that data is the new world currency, and the web is the exchange bureau through which it's traded.
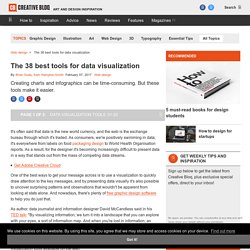
As consumers, we're positively swimming in data; it's everywhere from labels on food packaging design to World Health Organisation reports. As a result, for the designer it's becoming increasingly difficult to present data in a way that stands out from the mass of competing data streams. Get Adobe Creative Cloud One of the best ways to get your message across is to use a visualization to quickly draw attention to the key messages, and by presenting data visually it's also possible to uncover surprising patterns and observations that wouldn't be apparent from looking at stats alone.
Vega: A Visualization Grammar. Dynamic D3 with Knockout.js. A couple of things happened recently that prompted me to write this blog post.
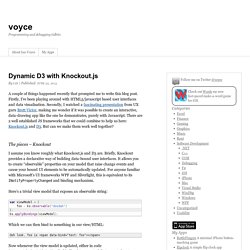
Firstly, I’ve been playing around with HTML5/javascript based user interfaces and data visualisation. Secondly, I watched a fascinating presentation from UX guru Brett Victor, making me wonder if it was possible to create an interactive, data-drawing app like the one he demonstrates, purely with Javascript. JavaScript InfoVis Toolkit.