
Visualization Taxonomies - The Extreme Presentation(tm) Method. With the explosion of interest in information visualization, I find taxonomies of visualization approaches to be very useful in organizing knowledge and facilitating use of different visualization approaches.
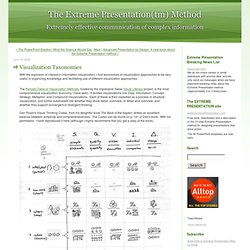
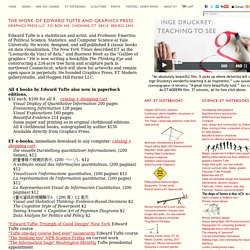
The Periodic Table of Visualization Methods, hosted by the impressive Swiss Visual Literacy project, is the most comprehensive visualization taxonomy I have seen. It divides visualizations into Data, Information, Concept, Strategy, Metaphor, and Compound Visualizations. Each of these is then classified as a process or structure visualization, and further subdivided into whether they show detail, overview, or detail and overview, and whether they support convergent or divergent thinking. Dan Roam's Visual Thinking Codex, from his delightful book The Back of the Napkin, strikes an excellent balance between simplicity and comprehensiveness. The Codex can be found on p. 141 of Dan's book. Blog.
Just a couple more stops until the Death Star.

@sean_voegeli Many of our employees live a long way from the office. The Work of Edward Tufte and Graphics Press. Edward Tufte is a statistician and artist, and Professor Emeritus of Political Science, Statistics, and Computer Science at Yale University.
He wrote, designed, and self-published 4 classic books on data visualization. The New York Times described ET as the "Leonardo da Vinci of data," and Business Week as the "Galileo of graphics. " He is now writing a book/film The Thinking Eye and constructing a 234-acre tree farm and sculpture park in northwest Connecticut, which will show his artworks and remain open space in perpetuity. He founded Graphics Press, ET Modern gallery/studio, and Hogpen Hill Farms LLC. Perceptual Edge.