
Spearman's Rank-Order Correlation - A guide to when to use it, what it does and what the assumptions are. This guide will tell you when you should use Spearman's rank-order correlation to analyse your data, what assumptions you have to satisfy, how to calculate it, and how to report it.
Statistical Test Calculators. Interview with researcher. How to Write a Psychology Research Paper. Start by finding out what type of paper your instructor expects you to write.
Developing a Quantitative Research Plan: Choosing a Research Design. Correlation: Introduction. Correlation: Introduction.
PSPP. Features[edit] This software provides a comprehensive set of capabilities including frequencies, cross-tabs comparison of means (t-tests and one-way ANOVA); linear regression, logistic regression, reliability (Cronbach's alpha, not failure or Weibull), and re-ordering data, non-parametric tests, factor analysis, cluster analysis, principal components analysis, chi-square analysis and more.
Some very advanced statistical tests are as of 2014 not yet implemented. At the user's choice, statistical output and graphics are available in ASCII, PDF, PostScript, SVG or HTML formats. A range of statistical graphs can be produced, such as histograms, pie-charts scree plots and np-charts. PSPP can import Gnumeric and OpenDocument spreadsheets, Postgres databases, comma-separated values and ASCII files. Origins[edit] Release history[edit] PSPP 0.8.3 running on Windows 7. Third Party Reviews[edit] See also[edit] References[edit] External links[edit] Third-party resources[edit] AS Psychology - Holah.co.uk - Correlation V2. Here are some exam style questions.
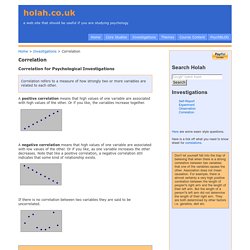
Here is a tick off what you need to know sheet for correlations. Don't let yourself fall into the trap of believing that when there is a strong correlation between two variables that one of the variables causes the other. Association does not mean causation. Correlation (Pearson, Kendall, Spearman) - Statistics Solutions. Correlation is a bivariate analysis that measures the strengths of association between two variables.
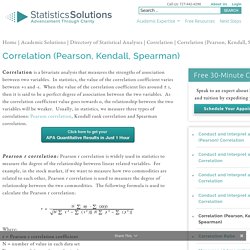
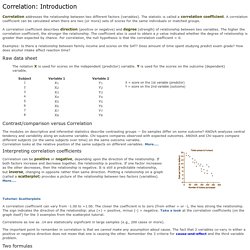
In statistics, the value of the correlation coefficient varies between +1 and -1. When the value of the correlation coefficient lies around ± 1, then it is said to be a perfect degree of association between the two variables. As the correlation coefficient value goes towards 0, the relationship between the two variables will be weaker. Encyclopedia of Psychology. Correlation Method in Psychology. By Saul McLeod published 2008 Correlation means association - more precisely it is a measure of the extent to which two variables are related.
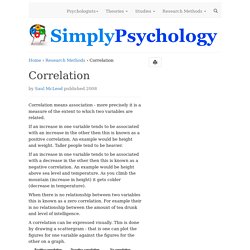
If an increase in one variable tends to be associated with an increase in the other then this is known as a positive correlation. An example would be height and weight. Taller people tend to be heavier. Honors Program Thesis Archives. Determining Sample Size: How to Ensure You Get the Correct Sample Size. How many responses do you really need?
This simple question is a never-ending quandary for researchers. A larger sample can yield more accurate results — but excessive responses can be pricey. Consequential research requires an understanding of the statistics that drive sample size decisions. A simple equation will help you put the migraine pills away and sample confidently. #YouHadToBeThere: On Social Media & Self-Esteem. By Hibaq Loyan Every Friday evening, I am faced with the quintessential youth dilemma: go out or stay in?

The fatigue of a long school week and plethora of new Netflix options answer the question for me, I shut off my phone and turn on the TV. For several hours, I am freed from incessant texts and status updates. Despite being in solitude, I am at peace with the silence and let my thoughts float in my head without interruptions.
For the first time all week, I can aptly describe myself as “relaxed.” Social media study casts light on online emotional connections, anxiety : Office of Media Relations. By Krishna De La Cruz University News Service April 24, 2013 A study of social media conducted by former Texas State University graduate student, Russell Clayton, is making national news out of Missouri.
Clayton’s master thesis, conducted under the supervision of Randall Osborne, Brian Miller and Crystal Oberle of Texas State, surveyed more than 225 college freshmen concerning their perceived levels of loneliness, anxiousness, alcohol use and marijuana use in the prediction of emotional connectedness to Facebook. Multiple media use tied to depression, anxiety.
Using multiple forms of media at the same time – such as playing a computer game while watching TV – is linked to symptoms of anxiety and depression, scientists have found for the first time. Michigan State University’s Mark Becker, lead investigator on the study, said he was surprised to find such a clear association between media multitasking and mental health problems. What’s not yet clear is the cause. How to Write Research Paper Fast [Guide] Research paper is considered as a long term assignment, when you have to spend a lot of time on research and then even more time to put the materials together and write a decent research paper. However, what if you don't have all that time? What if you've procrastinated too much, and the deadline is tomorrow but you have no ideas, no inspiration and no research materials for your paper.
And you don't want to buy research paper online. Independent categorical data and dependent continuous data. Which SPSS analysis can I apply? - ResearchGate. Hi, I have collected data for a study and I have both categorical data with two groups (i.e., male and female) and categorical data with more than two groups (e.g., employed full time, employed part time, in education, not working etc.). I also have continuous data which is ratings on a Likert Scale which add up to one score. I want to see if the categorical variables are significantly different from each other in terms of means.
Statistics Tutorial - Help on Statistics and Research. How to Use Google Forms to Collect Data. How to use regular expressions in Google Forms? Dividing a Continuous Variable into Categories. COMMON MISTEAKS MISTAKES IN USING STATISTICS: Spotting and Avoiding Them Introduction Types of Mistakes Suggestions Resources Table of Contents About This is also known by other names such as "discretizing," "chopping data," or "binning".1 Specific methods sometimes used include "median split" or "extreme third tails". Whatever it is called, it is usually2 a bad idea.
Instead, use a technique (such as regression) that can work with the continuous variable.The basic reason is intuitive: You are tossing away information. This can occur in various ways with various consequences. How to dichotomize variables?