
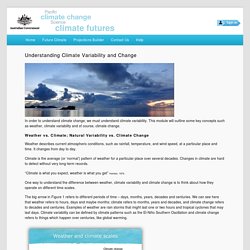
Atmospheric circulation. Idealised depiction (at equinox) of large scale atmospheric circulation on Earth. Long-term mean precipitation by month Atmospheric circulation is the large-scale movement of air, and together with ocean circulation is the means by which thermal energy is redistributed on the surface of the Earth. The Earth's atmospheric circulation varies from year to year, but the large scale structure of its circulation remains fairly constant. The smaller scale weather systems – mid-latitude depressions, or tropical convective cells – occur "randomly", and long range weather predictions of those cannot be made beyond ten days in practice, or a month in theory (see Chaos theory and Butterfly effect). The large scale atmospheric circulation of the Earth, however, is an average of its systems and patterns, and is considered stable over longer periods of time. Barotropic fluid. Baroclinity.
Rossby wave. Record blocking patterns fueling extreme weather: detailed look at why it’s so cold. By Rick GrowMarch 21, 2013 Many a March has featured wild gyrations in temperatures from start to finish, but the extremes of this month and a year ago have given “springtime variability” a completely new meaning.

The meteorology behind our current bone-chillingly cold weather is every bit as impressive as that which drove a stunning heat wave exactly one year ago. Upper level pressure pattern late March 2013 (WeatherBell.com) These hot and cold events arose from two large atmospheric “blocks,” last year’s – which brought the heat – was anchored close to home while this year’s formed 2,000-plus miles away over Greenland in recent days.
It’s this second blocking pattern that is steering sub-zero cold out of the Polar region into the U.S. 514 daily snowfall records were broken in March 2012, primarily across the Western U.S. 2 C Coming On Faster Than We Feared — Atmospheric Methane Spikes to Record 3096 Parts Per Billion. It’s essential that policymakers begin to seriously consider the possibility of a substantial permafrost carbon feedback to global warming.
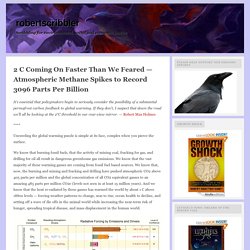
If they don’t, I suspect that down the road we’ll all be looking at the 2°C threshold in our rear-view mirror. — Robert Max Holmes Unraveling the global warming puzzle is simple at its face, complex when you pierce the surface. We know that burning fossil fuels, that the activity of mining coal, fracking for gas, and drilling for oil all result in dangerous greenhouse gas emissions. We know that the vast majority of these warming gasses are coming from fossil fuel based sources. Concern Over Catastrophic Methane Release — Overburden, Plumes, Eruptions, and Large Ocean Craters. The amount of methane in the Arctic hydrates alone is estimated as 400 times more than the global atmospheric CH4 burden.
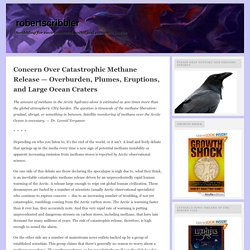
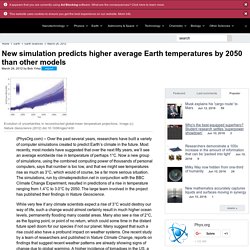
The question is timescale of the methane liberation: gradual, abrupt, or something in between. Satellite monitoring of methane over the Arctic Ocean is necessary. — Dr. Earth Time Lapse View from Space, Fly Over NASA, ISS on Vimeo. ISS Symphony - Timelapse of Earth from International Space Station. All Alone in the Night - Time-lapse footage of the Earth as seen from the ISS. Nasa Time Lapse Video: Incredible views of earth from the International Space Station. New simulation predicts higher average Earth temperatures by 2050 than other models. (PhysOrg.com) -- Over the past several years, researchers have built a variety of computer simulations created to predict Earth’s climate in the future.
Al Gore and Framing or How I Learned to Stop Worrying and Love Scientific Data – The Island of Doubt. We can’t stop arguing about framing, can we?
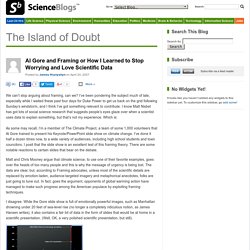
I’ve been pondering the subject much of late, especially while I waited these past four days for Duke Power to get us back on the grid following Sunday’s windstorm, and I think I’ve got something relevant to contribute. I know Matt Nisbet has got lots of social science research that suggests people’s eyes glaze over when a scientist uses data to explain something, but that’s not my experience. Edição especial: água e mudanças do clima - Maio de 2015 - Sumários. Mudanças climáticas podem reduzir em 44% a grande circulação das águas do Atlântico. Mudanças climáticas podem reduzir em 44% a grande circulação das águas do Atlântico. Mudanças climáticas podem gerar rombo financeiro trilionário. São Paulo - As mudanças climáticas podem gerar um rombo de US$ 2,5 trilhões no valor dos ativos financeiros em todo o mundo, de acordo com a primeira grande estimativa de modelagem econômica já realizada sobre o assunto.

Essas perdas valem para o cenário da temperatura média da superfície global alcançar 2,5° C acima do nível pré-industrial, até 2100. CIA investiga clima como arma de destruição em massa. Climate Futures. In order to understand climate change, we must understand climate variability.
This module will outline some key concepts such as weather, climate variability and of course, climate change. Weather vs. Climate; Natural Variability vs. Climate Change Weather describes current atmospheric conditions, such as rainfall, temperature, and wind speed, at a particular place and time. Climate is the average (or ‘normal’) pattern of weather for a particular place over several decades. Climate Variability and Extremes. When it comes to exploring our vulnerability to the varying climate, it is the extreme events that provide the most important messages.
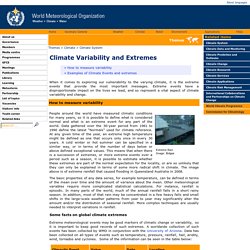
Extreme events have a disproportionate impact on the lives we lead, and so represent a vital aspect of climate variability and change. CCl FAQs. Activity 9 Teacher Guide: Climate Variability. In this activity students will simulate climate variability and come to understand that long-term climate averages are the result of significant annual climate variability.
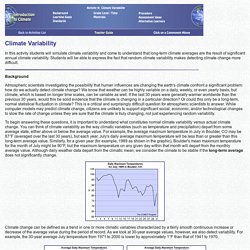
Students will be able to express the fact that random climate variability makes detecting climate change more difficult. Background Atmospheric scientists investigating the possibility that human influences are changing the earth's climate confront a significant problem: how do we actually detect climate change? Oceans in Motion: Waves and Tides. Why does the ocean have waves? The ocean is never still.
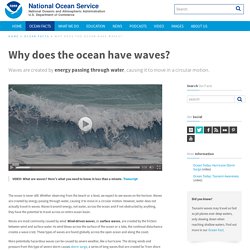
Whether observing from the beach or a boat, we expect to see waves on the horizon. Waves are created by energy passing through water, causing it to move in a circular motion. However, water does not actually travel in waves. Waves transmit energy, not water, across the ocean and if not obstructed by anything, they have the potential to travel across an entire ocean basin. Waves are most commonly caused by wind. More potentially hazardous waves can be caused by severe weather, like a hurricane. The gravitational pull of the sun and moon on the earth also causes waves. Waves transmit energy, not water, and are commonly caused by the wind as it blows across the ocean, lakes, and rivers. Siffer: Nettverk (10:10) Global temperature evolution 1979–2010. We analyze five prominent time series of global temperature (over land and ocean) for their common time interval since 1979: three surface temperature records (from NASA/GISS, NOAA/NCDC and HadCRU) and two lower-troposphere (LT) temperature records based on satellite microwave sensors (from RSS and UAH).
All five series show consistent global warming trends ranging from 0.014 to 0.018 K yr−1. When the data are adjusted to remove the estimated impact of known factors on short-term temperature variations (El Niño/southern oscillation, volcanic aerosols and solar variability), the global warming signal becomes even more evident as noise is reduced. Neil deGrasse Tyson and a dog explain the difference between climate and weather. From Dog Walking To Weather And Climate. Closures/Emergencies Skip to main content From Dog Walking To Weather And Climate. Forecasting by Analogy: Local Responses to Global Climate Change.