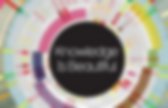
The Minard System - Sandra Rendgen. “The Minard System,” a book to be published in November 2018, features “the complete statistical graphics of Charles-Joseph Minard — from the collection of the École nationale des Ponts et Chaussées”.
In the text that follows, which constitutes the preface of the book, Sandra Rendgen explores how Minard’s oeuvre is much larger than the few (and beautiful) pieces that have become to be known as the “best statistical graphics ever drawn,” and how the French civil servant created a truly novel method to display stunning and accurate statistic drawings. by Sandra Rendgen Author and editor of The Minard System. www.sandrarendgen.de As for my maps, I have heard people say that illustrative maps have been made for a long time. My maps do not just show, they also count, they calculate for the eye; that is the crucial point, the amendment I have introduced through the width of the zones in my figurative maps and through the rectangles in my graphic tableaus. — Charles-Joseph Minard, 1861. Global Disaster Preparedness Center. How might we be more data ready?
For the past 2 years, IFRC has been on an internal journey to improve data literacy across teams, sectors, the IFRC Secretariat, and within National Societies. Data skills and data readiness improve our ability to use and obtain information to support and improve our decision-making. We are leaving people behind by not being equitable in the application of data skills, technology and the potential opportunities this brings. Introduction to Data Science. Making Data Visual. Making Data Visual - O'Reilly Media. You have a mound of data front of you and a suite of computation tools at your disposal.
Which parts of the data actually matter? Where is the insight hiding? If you’re a data scientist trying to navigate the murky space between data and insight, this practical book shows you how to make sense of your data through high-level questions, well-defined data analysis tasks, and visualizations to clarify understanding and gain insights along the way. When incorporated into the process early and often, iterative visualization can help you refine the questions you ask of your data. Authors Danyel Fisher and Miriah Meyer provide detailed case studies that demonstrate how this process can evolve in the real world.
Network Science by Albert-László Barabási. Introduction · The Curious Journalist's Guide to Data. The Curious Journalist's Guide to Data. Data Science Live Book. World of Mathematics. Mathigon. GitHub - jakevdp/PythonDataScienceHandbook: Jupyter Notebooks for the Python Data Science Handbook. 19 Free eBooks to learn programming with Python. – Mybridge for Professionals. This is a collection of the most useful free ebooks to learn programming for both beginners and advanced Python users.
Python is a popular programming language used for a variety purposes from web development and software automation to machine learning. In this observation, we compared nearly 500 ebooks related to Python programming language and sized the number down to 19. Spammy content that try to lure you with ads, time-wasting content and old content are not included. To evaluate the quality, Mybridge AI considered a variety of factors to determine how useful the content are for programmers. To give you an idea about the quality, ebooks here have an average Amazon rating of 4.5 stars.
All of the content here can be read for free. Hopefully, you’ll find this curation useful and use it as a reference that you can come back whenever you’re learning to program with Python. Green Tea Press – Free books by Allen Downey. Neural networks and deep learning. Deep Learning. David MacKay: Information Theory, Inference, and Learning Algorithms: The Book.
Download the book too You can browse and search the book on Google books.
You may download The book in one file (640 pages): Notes: Version 6.0 was released Thu 26/6/03; the book is finished. You are welcome to view the book on-screen. Copyright issues: The book is copyright (c) Cambridge University Press. Now the book is published, these files will remain viewable on this website. History: Draft 1.1.1 - March 14 1997. Here is my method for converting to two-up under linux:pstops '4:0L@.67(20cm,1cm)+1L@.67(20cm,15cm),3R@.67(1cm,15.25cm)\ +2R@.67(1cm,29.25cm)' $*.ps $*.dps.
David Barber : Brml - Home Page browse. Elements of Statistical Learning: data mining, inference, and prediction. 2nd Edition. Jupyter Notebook Viewer. Probabilistic Programming & Bayesian Methods for Hackers¶ Using Python and PyMC¶ The Bayesian method is the natural approach to inference, yet it is hidden from readers behind chapters of slow, mathematical analysis.
The typical text on Bayesian inference involves two to three chapters on probability theory, then enters what Bayesian inference is. Unfortunately, due to mathematical intractability of most Bayesian models, the reader is only shown simple, artificial examples. This can leave the user with a so-what feeling about Bayesian inference. After some recent success of Bayesian methods in machine-learning competitions, I decided to investigate the subject again. If Bayesian inference is the destination, then mathematical analysis is a particular path to towards it. Introduction to Statistical Learning. An Introduction to Statistical Learning with Applications in R Gareth James, Daniela Witten, Trevor Hastie and Robert Tibshirani.
13 Free Self-Study Books on Mathematics, Machine Learning & Deep Learning. Introduction Getting learners to read textbooks and use other teaching aids effectively can be tricky.
Especially, when the books are just too dreary. In this post, we’ve compiled great e-resources for you digital natives looking to explore the exciting world of Machine Learning and Neural Networks. But before you dive into the deep end, you need to make sure you’ve got the fundamentals down pat. Euclid Book I. Search User Interfaces. Introduction · Data Visualization for All. Data Visualization for All · GitBook. Tell your story with free and easy-to-learn tools.
Data Visualization for All, an open-access textbook, shows how to design interactive charts and maps for your website. We begin with drag-and-drop tools and gradually work our way up to editing open-source code templates. This friendly introduction includes step-by-step tutorials, video screencasts, and real-world examples. Featured tools include Google Sheets, Tableau Public, Carto, Highcharts, Leaflet, GitHub, and more. About the authors: Jack Dougherty (Trinity College, CT) with Veronica X. Read for free online (recommended) or download the PDF or ePUB or Mobi/Kindle editions. Bookdown: Easy Book Publishing with R Markdown. Tidy Text Mining with R. Read It: Search User Interfaces. Read the Book The full text of this book can be read free of charge.
Select a chapter: 0: Preface: an overview of the structure of the book, and a guide to who should read which parts. 1: Design of Search User Interfaces: introduces the ideas and practices surrounding search interface design, places modern design in a historical context, and summarizes design guidelines for search interfaces. 2: Evaluation of Search User Interfaces: includes informal studies, formal studies, longitudinal studies and log-based analysis including bucket testing. Terms of Service By permission of Cambridge University Press, browsing the contents of the book on this web site is free. 35 invaluable books on Data Visualization. Are you a hard-core enthusiast of data visualization? Or a beginner, who wants to learn and be able to create more effective visualisations? Check out our list of 35 invaluable books you must read for better visualization.
(Some books in the list might not be directly connected to data visualization as such, but we included them because they were highly recommended by many data visualization experts. 1. Exploratory Data Analysis. GitHub - infoactive/data-design. 13a07b19e01a397d8855c0463d52f454. Visualization Analysis and Design - Tamara Munzner - Google Books. Designing Data Visualizations [Book] See and do more with your data, with Spotfire - eBook. NIST/SEMATECH e-Handbook of Statistical Methods. Wannabe Data Scientists! Learn the basics with these 7 books! – Medium. In the last few years I spent a significant time with reading books about Data Science.
I found these 7 books the best. These together are a very valuable source of learning the basics. It drives you through everything, you need to know. Though they are very enjoyable, none of these is light reading. So if you decided to go with them, allocate some time and energy. Note: you can see I listed four O’Reilly books here. I suggest this specific order: 1. The first book to read is about the basic business mindset about how to use data. 2. Dear Data: A Lyrical Illustrated Serenade to How Our Attention Shapes Our Reality. “Information is what our world runs on: the blood and the fuel, the vital principle,” James Gleick wrote in his indispensable history of how the age of data and human consciousness shaped one another.
A generation earlier, the great theoretical physicist John Archibald Wheeler proclaimed in what remains the most resonant chorus to our age: “All things physical are information-theoretic in origin and this is a participatory universe… Observer-participancy gives rise to information.” What we measure, monitor, record, and attend to is what colors our view of life.
And so it is that “observer-participancy” has become the hallmark — the chief currency, the focal lens — of our Information Age: The quality of our attention and the nature of its recorded representation have become the informational infrastructure of our reality. Free Must Read Books on Statistics & Mathematics for Data Science. Introduction The selection process of data scientists at Google gives higher priority to candidates with strong background in statistics and mathematics. Not just Google, other top companies (Amazon, Airbnb, Uber etc) in the world also prefer candidates with strong fundamentals rather than mere know-how in data science. Philographics — Studio Carreras. A Visual Dictionary of Philosophy: Major Schools of Thought in Minimalist Geometric Graphics. By Maria Popova Rodin believed that his art was about removing the stone not part of the sculpture to reveal the essence of his artistic vision.
Perhaps this is what Catalan-born, London-based graphic designer Genis Carreras implicitly intended in chiseling away the proverbial philosopher’s stone to sculpt its minimalist essence. Many moons ago, I discovered with great delight Carreras’s series of geometric graphics explaining major movements in philosophy and now, with the help of Kickstarter, the project has come to new life in book form. Philographics: Big Ideas in Simple Shapes (public library | IndieBound) is a vibrant visual dictionary of philosophy, enlisting the telegraphic powers of design in distilling the essential principles of 95 schools of thought into visual metaphors and symbolic representation.
Visualising Data: A Handbook for Data Driven Design. Graphic presentation. ACM ebooks Catalog. Reviews of Data Visualization books - Visual Cinnamon. 51 Free Data Science Books. Booz Allen Field Guide to Data Science. Trees, maps, and theorems. Books. VisMaster book lowres. Welcome to the School of Data Handbook. Interactive Data Visualization for the Web.
Enhanced with examples hosted on JS Bin, courtesy of Remy Sharp and his company, Left Logic. Free Book: Probabilistic and Statistical Modeling in Computer Science. Civil Statistician. 60+ Free Books on Big Data, Data Science, Data Mining, Machine Learning, Python, R, and more.