
Abel Coronado sur Twitter : "Think Bayes Bayesian Statistics Made Simple #datascience #machinelearning... Think Bayes. Bayesian Statistics Made Simple by Allen B.
Downey Download Think Bayes in PDF. Read Think Bayes in HTML. Order Think Bayes from Amazon.com. Read the related blog, Probably Overthinking It. Description Think Bayes is an introduction to Bayesian statistics using computational methods. The premise of this book, and the other books in the Think X series, is that if you know how to program, you can use that skill to learn other topics. Most books on Bayesian statistics use mathematical notation and present ideas in terms of mathematical concepts like calculus. I think this presentation is easier to understand, at least for people with programming skills. Think Bayes is a Free Book. Other Free Books by Allen Downey are available from Green Tea Press. Download. Abel Coronado sur Twitter : "Probabilistic Programming & Bayesian Methods for Hackers #datascience #machinelearning. Bayesian Methods for Hackers. An intro to Bayesian methods and probabilistic programming from a computation/understanding-first, mathematics-second point of view.
Prologue The Bayesian method is the natural approach to inference, yet it is hidden from readers behind chapters of slow, mathematical analysis. The typical text on Bayesian inference involves two to three chapters on probability theory, then enters what Bayesian inference is. Unfortunately, due to mathematical intractability of most Bayesian models, the reader is only shown simple, artificial examples. This can leave the user with a so-what feeling about Bayesian inference. After some recent success of Bayesian methods in machine-learning competitions, I decided to investigate the subject again.
Announcing SparkR: R on Spark. Join us at the Spark Summit to learn more about SparkR.
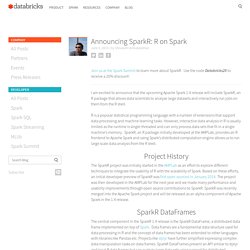
Use the code Databricks20 to receive a 20% discount! I am excited to announce that the upcoming Apache Spark 1.4 release will include SparkR, an R package that allows data scientists to analyze large datasets and interactively run jobs on them from the R shell. R is a popular statistical programming language with a number of extensions that support data processing and machine learning tasks. However, interactive data analysis in R is usually limited as the runtime is single-threaded and can only process data sets that fit in a single machine’s memory. SparkR, an R package initially developed at the AMPLab, provides an R frontend to Apache Spark and using Spark’s distributed computation engine allows us to run large scale data analysis from the R shell.
Project History. Microsoft Project Oxford Home. Using Latent Dirichlet Allocation to Categorize My Twitter Feed. Over the past 3 years, I have tweeted about 4100 times, mostly URLS, and mostly about machine learning, statistics, big data, etc.
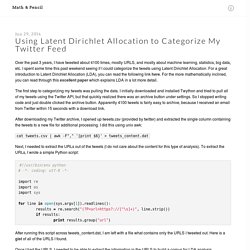
I spent some time this past weekend seeing if I could categorize the tweets using Latent Dirichlet Allocation. For a great introduction to Latent Dirichlet Allocation (LDA), you can read the following link here. For the more mathematically inclined, you can read through this excellent paper which explains LDA in a lot more detail. The first step to categorizing my tweets was pulling the data. I initially downloaded and installed Twython and tried to pull all of my tweets using the Twitter API, but that quickly realized there was an archive button under settings.
After downloading my Twitter archive, I opened up tweets.csv (provided by twitter) and extracted the single column containing the tweets to a new file for additional processing. Cat tweets.csv | awk -F"," '{print $6}' > tweets_content.dat #! Nltk.clean_html(urlopen(url).read()) Latent Semantic Analysis (LSA) Tutorial. Latent Semantic Analysis (LSA), also known as Latent Semantic Indexing (LSI) literally means analyzing documents to find the underlying meaning or concepts of those documents.

If each word only meant one concept, and each concept was only described by one word, then LSA would be easy since there is a simple mapping from words to concepts. Unfortunately, this problem is difficult because English has different words that mean the same thing (synonyms), words with multiple meanings, and all sorts of ambiguities that obscure the concepts to the point where even people can have a hard time understanding. For example, the word bank when used together with mortgage, loans, and rates probably means a financial institution. On Building a Data Science Curriculum. DataWeek: Intro to Data Science and Machine Learning. Welcome · Advanced R. Gregory Piatetsky sur Twitter : "Computing platforms for #Analytics, #DataMining, #DataScience: most work on PC-sized data.
Computing Platforms for Analytics, Data Mining, Data Science. Gregory Piatetsky sur Twitter : "#Uber's #DataScience team reveals why #taxis may never be able to compete w/ their #SV #rivals. Why taxis can never compete with Uber. Gregory Piatetsky on Twitter: "24 free resources and online books on #DataMining, #DataScience, #MachineLearning, #Statistics.
More Free Data Mining, Data Science Books and Resources. More free resources and online books by leading authors about data mining, data science, machine learning, predictive analytics and statistics.
Spatial Statistics Society. Kirk Borne sur Twitter : "Deep Learning experiments with @h2oai package: #abdsc #DataScience #MachineLearning #Rstats. Experiments of Deep Learning with {h2o} package on R. Below is the latest post (and the first post in these 10 months...) of my blog.
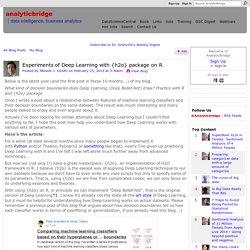
What kind of decision boundaries does Deep Learning (Deep Belief Net) draw? Practice with R and {h2o} package Once I wrote a post about a relationship between features of machine learning classifiers and their decision boundaries on the same dataset. The result was much interesting and many people looked to enjoy and even argued about it. Actually I've been looking for similar attempts about Deep Learning but I couldn't find anything so far. Here's the article: Arno Candel sur Twitter : "Check out the updated version of the H2O #DeepLearning booklet: @h2oai #datascience. DeepLearningBooklet_v2.pdf. LIONbook - intelligent-optimization.org for prescriptive analytics. Everyday Data Science with Thomas Ott: D3js Integration. Twitter. The Data Science Skills Network. Ferris is a full stack data scientist at LinkedIn who enjoys building products at the forefront of intelligent technology.
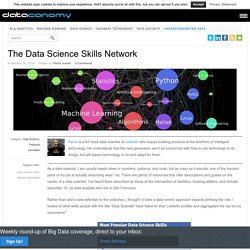
He understands that the next generation won’t be concerned with how to use technology to do things, but will expect technology to do and adapt for them. As a data scientist, I am usually heads down in numbers, patterns, and code, but as crazy as it sounds, one of the hardest parts of my job is actually describing what I do. There are plenty of resources that offer descriptions and guides on the career of a data scientist. Abel Coronado sur Twitter : "Curso de CIencia de Datos con #R por @abxda (Abel Coronado) Solicita Informes en #DataScience.
Taller de Ciencia de Datos con R. Abel Coronado sur Twitter : "#R Packages in a Cloud. #DataScience... 15 timeless data science articles. Abel Coronado sur Twitter : "Aqui casual, haciendo una estratificación multivariada con mi celular. #DataScience #R... Skills to be a data scientist. By Krzysztof Zawadzki on August 30, 2014 Data scientists are in high demand.
There is simply not enough talent to fill the jobs. Why? Because the sexiest job of 21th century requires a mixture of broad, multidisciplinary skills ranging from an intersection of mathematics, statistics, computer science, communication and business. Finding a data scientist is hard. More than 100 data science, analytics, big data, visualization books. Comparison of statistical software. Comparison of statistical software. Variable Selection in Market Segmentation: Clustering or Biclustering? Will you have that segmentation with one or two modes?
The data matrix for market segmentation comes to us with two modes, the rows are consumers and the columns are variables. Clustering uses all the columns to transform the two-mode data matrix (row and columns are different) into a one-mode distance matrix (rows and columns are the same) either directly as in hierarchical clustering or indirectly as in k-means. The burden falls on the analyst to be judicious in variable selection since too few will miss distinctions that ought to be made and too many will blur those distinctions that need to be made.
This point is worth repeating. Most data matrices have two modes with the rows and columns referring to different types. Such an all-or-none variable selection may seem too restrictive given the diversity of products in many categories. Biclustering offers a two-mode alternative that allows different clusters to be defined by different variables. Revisiting K-means as Matrix Factorization. Rapidly search all R programming language documentation. Machine Learning is too easy. Machine Learning is too easy One of the remarkable things about machine learning is how diverse it is. The viewpoints of Bayesian learning, reinforcement learning, graphical models, supervised learning, unsupervised learning, genetic programming, etc… share little enough overlap that many people can and do make their careers within one without touching, or even necessarily understanding the others.
There are two fundamental reasons why this is possible. For many problems, many approaches work in the sense that they do something useful. This is true empirically, where for many problems we can observe that many different approaches yield better performance than any constant predictor. The implications of this observation agrees with inspection of the field. Particular problems are often “solved” by the first technique applied to them. SAS-versus-R-35222.S. Big Data and Statisticians, Revisited (Video) Big Data and Statisticians, Revisited (Video) Data Science, Big Data and Statistics – can we all live together? From Chalmers Internal on Vimeo. Terry Speed on how (and a bit on why) statisticians have been left out of the big data movement. Best slide comes at 34:20 and I wish Speed have talked more about how his “personal statistical paradigm” contrasts with the ideology of big data.
“This is the Golden Age of statistics–but not necessarily for statisticians”–Gerry Hahn. Abxda : Reading... #DataScience #akka ... Brief introduction to Scala and Breeze for statistical computing. Introduction In the previous post I outlined why I think Scala is a good language for statistical computing and data science. In this post I want to give a quick taste of Scala and the Breeze numerical library to whet the appetite of the uninitiated. This post certainly won’t provide enough material to get started using Scala in anger – but I’ll try and provide a few pointers along the way. It also won’t be very interesting to anyone who knows Scala – I’m not introducing any of the very cool Scala stuff here – I think that some of the most powerful and interesting Scala language features can be a bit frightening for new users. To reproduce the examples, you need to install Scala and Breeze.
How to Create an Effective Data Science Department - Kim Stedman. Abxda : QUE TAL!!!!! U.S. Geological... Coursera.org. Coursera.org. Pragmatic Programming Techniques.
Scalable System Design. We Recommend These Resources Building scalable system is becoming a hotter and hotter topic. Mainly because more and more people are using computer these days, both the transaction volume and their performance expectation has grown tremendously. This one covers general considerations. I have another blogs with more specific coverage on DB scalability as well as Web site scalability. General Principles "Scalability" is not equivalent to "Raw Performance"Scalability is about reducing the adverse impact due to growth on performance, cost, maintainability and many other aspectse.g. Common Techniques (Note: Opinions expressed in this article and its replies are the opinions of their respective authors and not those of DZone, Inc.) How MySpace Tested Their Live Site with 1 Million Concurrent Users. This is a guest post by Dan Bartow, VP of SOASTA, talking about how they pelted MySpace with 1 million concurrent users using 800 EC2 instances.
I thought this was an interesting story because: that's a lot of users, it takes big cajones to test your live site like that, and not everything worked out quite as expected. I'd like to thank Dan for taking the time to write and share this article. In December of 2009 MySpace launched a new wave of streaming music video offerings in New Zealand, building on the previous success of MySpace music. These new features included the ability to watch music videos, search for artist’s videos, create lists of favorites, and more. PayPal Big Data and MySQL Cluster. Untangle the Integration Knot: Getting Started with HADOOP - Single Server, Multiple Node Simulation. Running Hadoop on Windows « Hayes Davis. What is Hadoop? Hadoop is a an open source Apache project written in Java and designed to provide users with two things: a distributed file system (HDFS) and a method for distributed computation.
It’s based on Google’s published Google File System and MapReduce concept which discuss how to build a framework capable of executing intensive computations across tons of computers. Something that might, you know, be helpful in building a giant search index. Read the Hadoop project description and wiki for more information and background on Hadoop.
What’s the big deal about running it on Windows? Algorithms - Apache Mahout. Apache Drill. Google's Mind-Blowing Big-Data Tool Grows Open Source Twin. Silicon Valley startup MapR has launched an open source project called Drill, which seeks to mimic a shocking effectively data-analysis tool built by Google Mike Olson and John Schroeder shared a stage at a recent meeting of Silicon Valley’s celebrated Churchill Club, and they didn’t exactly see eye to eye. Olson is the CEO of a Valley startup called Cloudera, and Schroeder is the boss at MapR, a conspicuous Cloudera rival. Both outfits deal in Hadoop — a sweeping open source software platform based on data center technologies that underpinned the rise of Google’s web-dominating search engine — but in building their particular businesses, the two startups approached Hadoop from two very different directions.
Whereas Cloudera worked closely with the open source Hadoop project to enhance the software code that’s freely available to the world at large, MapR decided to rebuild the platform from the ground up, and when that was done, it sold the new code as proprietary software. WebPlatform.org — Your Web, documented. Emgu CV: OpenCV in .NET (C#, VB, C++ and more) Welcome to opencv documentation! — OpenCV v2.4.2 documentation. Best paper awards at AAAI, ACL, CHI, CIKM, CVPR, FOCS, FSE, ICCV, ICML, ICSE, IJCAI, INFOCOM, KDD, NSDI, OSDI, PLDI, PODS, S&P, SIGCOMM, SIGIR, SIGMOD, SODA, SOSP, STOC, UIST, VLDB, WWW.
D3.js - Data-Driven Documents. EPJ Data Science - a SpringerOpen journal.