
Sentiment Analysis. LSA. How to handle Imbalanced Classification Problems in machine learning? How to handle Imbalanced Classification Problems in machine learning? Spearmans. 26 Great Articles and Tutorials about Regression Analysis. Twitter. Complete guide to create a Time Series Forecast (with Codes in Python) Learn the steps to create a Time Series forecastAdditional focus on Dickey-Fuller test & ARIMA (Autoregressive, moving average) modelsLearn the concepts theoretically as well as with their implementation in python.

Lesson1. DataOrigami. 12 Algorithms Every Data Scientist Should Know.
Deep Learning. Bayesian - Estimating the covariance posterior distribution of a multivariate gaussian. PAC. F Distribution. Machine Learning in 7 Pictures. Basic machine learning concepts of Bias vs Variance Tradeoff, Avoiding overfitting, Bayesian inference and Occam razor, Feature combination, Non-linear basis functions, and more - explained via pictures.
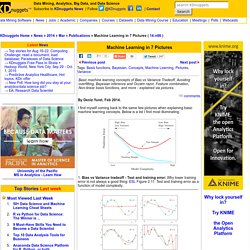
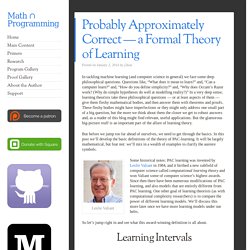
By Deniz Yuret, Feb 2014. I find myself coming back to the same few pictures when explaining basic machine learning concepts. Below is a list I find most illuminating. 1. Bias vs Variance tradeoff - Test and training error: Why lower training error is not always a good thing: ESL Figure 2.11. 2. 3. 4. 5. 6. 7. Occam’s Razor and PAC-learning. So far our discussion of learning theory has been seeing the definition of PAC-learning, tinkering with it, and seeing simple examples of learnable concept classes.

We’ve said that our real interest is in proving big theorems about what big classes of problems can and can’t be learned. One major tool for doing this with PAC is the concept of VC-dimension, but to set the stage we’re going to prove a simpler theorem that gives a nice picture of PAC-learning when your hypothesis class is small. In short, the theorem we’ll prove says that if you have a finite set of hypotheses to work with, and you can always find a hypothesis that’s consistent with the data you’ve seen, then you can learn efficiently. Probably Approximately Correct — a Formal Theory of Learning.
In tackling machine learning (and computer science in general) we face some deep philosophical questions.
Questions like, “What does it mean to learn?” And, “Can a computer learn?” And, “How do you define simplicity?” And, “Why does Occam’s Razor work? All entries. Metodi Statistici per l'Apprendimento. Orario lezioni.
Welcome. The Two Cultures: statistics vs. machine learning? Dictionary of Algorithms and Data Structures. How Do I Start Learning Data Analysis? As an instructor in the Data Analyst Nanodegree, I know how important it is to have a learning plan when starting something new.

When I first started learning about data analysis and data science three years ago, I came across the following roadmap of skills, and I couldn’t help but feel overwhelmed. Where do I start? What programming language should I learn first? And why are the names of animals included in the list of skills (I’m looking at you Python, Pandas, and Pig)? Overview of statistics. Putting the methods you use into context It may come as a surprise, but the way you were probably taught statistics during your undergraduate years is not the way statistics is done.
Sampling Distribution of Difference Between Means. Sampling Distribution of Difference Between Means Author(s) David M.
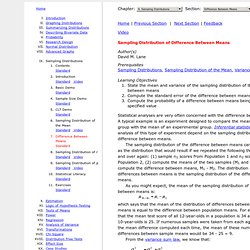
Lane Prerequisites Sampling Distributions, Sampling Distribution of the Mean, Variance Sum Law I. Olivier Cappé's Home Page. All entries.
www.statisticshell.com/docs/ancova.pdf. Www.sagepub.com/upm-data/21121_Chapter_15.pdf. Julia express. Julia Statistics. Generalized linear model. Linear regression. In statistics, linear regression is an approach for modeling the relationship between a scalar dependent variable y and one or more explanatory variables denoted X.
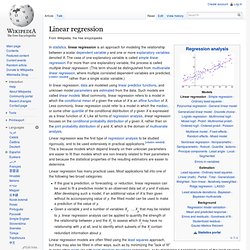
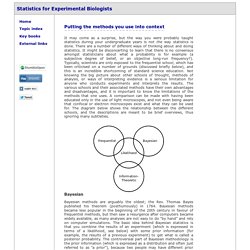
The case of one explanatory variable is called simple linear regression. For more than one explanatory variable, the process is called multiple linear regression. Ordinary least squares. Okun's law in macroeconomics states that in an economy the GDP growth should depend linearly on the changes in the unemployment rate.

Here the ordinary least squares method is used to construct the regression line describing this law. In statistics, ordinary least squares (OLS) or linear least squares is a method for estimating the unknown parameters in a linear regression model. This method minimizes the sum of squared vertical distances between the observed responses in the dataset and the responses predicted by the linear approximation. Generalized least squares. Method outline[edit] In a typical linear regression model we observe data on n statistical units.
The response values are placed in a vector Y = (y1, ..., yn)′, and the predictor values are placed in the design matrix X = [[xij]], where xij is the value of the jth predictor variable for the ith unit. The model assumes that the conditional mean of Y given X is a linear function of X, whereas the conditional variance of the error term given X is a known matrix Ω. This is usually written as. Www.utdallas.edu/~serfling/3332/COVandCORR. Dummy variable (statistics) In statistics and econometrics, particularly in regression analysis, a dummy variable (also known as an indicator variable, design variable, Boolean indicator, categorical variable, binary variable, or qualitative variable[1][2]) is one that takes the value 0 or 1 to indicate the absence or presence of some categorical effect that may be expected to shift the outcome.[3][4] Dummy variables are used as devices to sort data into mutually exclusive categories (such smoker/non-smoker, etc.).[2] For example, in econometric time series analysis, dummy variables may be used to indicate the occurrence of wars or major strikes.
Electrical Engineering and Computer Science. The Gaussian Processes Web Site.