
Image mapping on mesh. Social Complexity. Modularity. Data Art. Grasshopper Data Visualization by Siddhesh Kale. Global School 2011 » Rhino/Grasshopper. Data visualization. Force-Based Data Visualization. Using a combination of Slingshot!
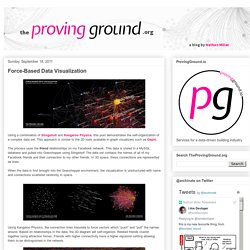
And Kangaroo Physics, this post demonstrates the self-organization of a complex data set. This approach is similar to the 2D tools available in graph visualizers such as Gephi. The process uses the friend relationships on my Facebook network. This data is stored in a MySQL database and pulled into Grasshopper using Slingshot! The data set contains the names of all of my Facebook friends and their connection to my other friends. Datavisualization.ch Selected Tools.
Infographics from KISSmetrics. Piktochart: Infographic and Graphic Design for Non-Designers. Mantis. Mathematica is a tool for technical computing that is used by mathematicians, engineers, analysts, and many others around the world.
Mathematica is renowned as the world's ultimate application for computations. But it's much more, It contains an extensive knowledge base for working with a very broad range of tasks, including solving equations, programming, importing and exporting data, visualizing functions and data, and much more. Grasshopper is providing a graphical algorithmic process for generating computational models through a mapping process of design objectives onto step-by-step descriptions. P i n u p s p a c e.