
Ideas, issues, knowledge, data - visualized! Infographics. Easelly - create infographics. Infographics & Data Visualizations. Ultimate Guide to Create/Design an Infographic. There is an updated version of resources to design your own infographics.
Check it out! Introduction to Infographics Why Create Infographics? This is a step by step guide on how you can design an infographic and market it successfully. The link will take you to why infographics (where infographics came from). Who is Piktochart for? Piktochart was created for a non-designer, someone who does not have much time to learn how to use a tool. About Piktochart. Create infographics & online charts. 5 Unbeatable Types of Infographic + Free Tools to Create Them. An infographic (information graphic) has been a very effective way to bait for links and social media votes for ages.

Like anything else, it can be done right or wrong (I am sure you have seen dozens of poorly implemented infographics by now and maybe a few really good ones). How to create a good one? The secret is in days (maybe months) of brainstorming. A cool concept doesn’t even have to be too very well-designed. All you need is a great idea and some time of putting it together.
This post lists 5 unbeatable (when done right) types of infographics as well as free tools to help you put your ideas to life – enjoy! 1. As the periodic table hangs in thousands of classrooms all over the world, it has become a visual metaphor and serves now as a template for knowledge presentation in various niches and verticals. Examples: Over 100 Incredible Infographic Tools and Resources (Categorized) This post is #6 in DailyTekk’s famous Top 100 series which explores the best startups, gadgets, apps, websites and services in a given category.

Total items listed: 112. Time to compile: 8+ hours. Follow @DailyTekk on Twitter to make sure you don’t miss a week! 15 Useful Infographics For Designers And Developers. Writen by Bogdan / Comments Off on 15 Useful Infographics For Designers And Developers Information graphics or infographics are graphic visual representations of information, data or knowledge.
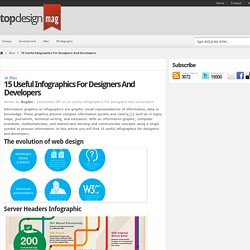
These graphics present complex information quickly and clearly,[1] such as in signs, maps, journalism, technical writing, and education. With an information graphic, computer scientists, mathematicians, and statisticians develop and communicate concepts using a single symbol to process information. In this article you will find 15 useful infographics for designers and developers. The evolution of web design Server Headers Infographic Why Websites Speed Really Matters Photoshop Etiquette Manifesto Cloud Computing Landscape Understanding Google PageRank Hackers: How they get, and got in Anatomy of a WordPress Theme The anatomy of a perfect landing page Visual Guide to SEO The Evolution of Typography Computer Programming Languages Chart HTTP Headers Status Diagram Periodic Table of the Perl6 Operators.
10 Awesome Tools To Make Infographics. Advertisement Who can resist a colourful, thoughtful venn diagram anyway?

In terms of blogging success, infographics are far more likely to be shared than your average blog post. This means more eyeballs on your important information, more people rallying for your cause, more backlinks and more visits to your blog. In short, a quality infographic done well could be what your blog needs right now. 10 Gorgeous Social Media Infographics. Infographics make information easy to consume. Mundane Charts vs Info graphics: Although they are essentially driven by the same set of information, our eyes are more attached to the ones that give aesthetic pleasure. Below are 10 that might suit your social media taste buds. 1. Building a Company with Social Media 2. Tools And Resources For Creating Infographics. Infographics.

You have probably seen them before. There are so many out there on a wide variety of topics. Here are just a few. How To Create Infographics - Illustrator CS4 Tut. In this tutorial you will learn that data doesn't have to be boring, it can be beautiful!

Learn how to use various graph tools, illustration techniques and typography to make an accurate and inspiring infographic in Adobe Illustrator. Start by using the Rectangle Tool (M) to draw a shape. Give it a subtle radial gradient too. The entire design is based on a grid of four columns. To make the columns first select the rectangle and drag a guide onto the centre of the shape. Condense the shape so it fits within the left-most guide and centre guide. Move the shape over to the right and add another guide to the centre here. Using the Rectangle Tool (M) draw a thin white box on the centre line that will be the width of the gap between the columns. Repeat the process for the other columns with your final result being below. I like to place the most important graphics first and work-in the ancillary charts and graphs afterwards.
Give the circles a variety of gradients. That's it!