
Slow-motion wrecks: how thawing permafrost is destroying Arctic cities | Cities At first, Yury Scherbakov thought the cracks appearing in a wall he had installed in his two-room flat were caused by shoddy workmanship. But then other walls started cracking, and then the floor started to incline. “We sat on the couch and could feel it tilt,” says his wife, Nadezhda, as they carry furniture out of the flat. Yury wasn’t a poor craftsman, and Nadezhda wasn’t crazy: one corner of their five-storey building at 59 Talnakhskaya Street in the northern Russian city of Norilsk was sinking as the permafrost underneath it thawed and the foundation slowly disintegrated. Cracking and collapsing structures are a growing problem in cities like Norilsk – a nickel-producing centre of 177,000 people located 180 miles above the Arctic Circle – as climate change thaws the perennially frozen soil and increases precipitation. In most cases, these are slow-motion wrecks that can be patched up or prevented by engineering solutions. But sometimes changes come too suddenly.
Carte. En 2040, une planète dangereusement aride L’auteur. Cette carte a été réalisée par notre cartographe, Thierry Gauthé, en collaboration avec notre journaliste Carole Lembezat. D’ici à vingt-cinq ans, la question de l’eau risque de devenir un problème majeur pour la planète. » Cliquer ici pour afficher la carte en plus grand Dans un monde plus peuplé, plus urbain, la question des ressources, combinée au réchauffement climatique, va se poser avec de plus en plus d’acuité. Rate of environmental degradation puts life on Earth at risk, say scientists Humans are “eating away at our own life support systems” at a rate unseen in the past 10,000 years by degrading land and freshwater systems, emitting greenhouse gases and releasing vast amounts of agricultural chemicals into the environment, new research has found. Two major new studies by an international team of researchers have pinpointed the key factors that ensure a livable planet for humans, with stark results. Of nine worldwide processes that underpin life on Earth, four have exceeded “safe” levels – human-driven climate change, loss of biosphere integrity, land system change and the high level of phosphorus and nitrogen flowing into the oceans due to fertiliser use. Researchers spent five years identifying these core components of a planet suitable for human life, using the long-term average state of each measure to provide a baseline for the analysis. All of these changes are shifting Earth into a “new state” that is becoming less hospitable to human life, researchers said.
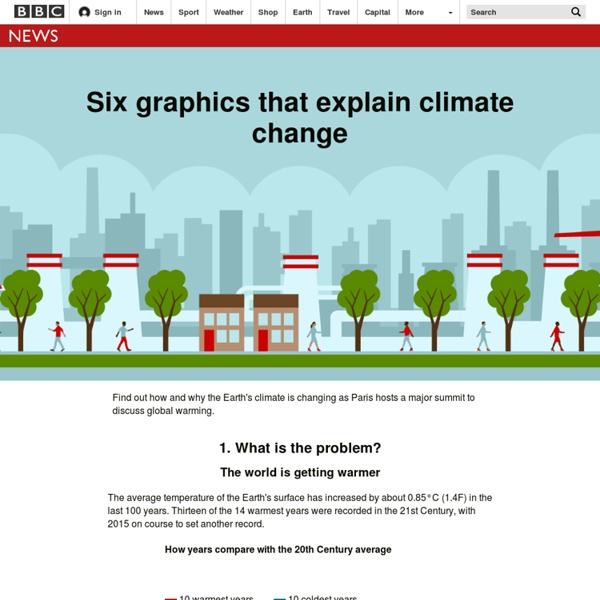
What is climate change? Media playback is unsupported on your device BBC News looks at what we know and don't know about the Earth's changing climate. What is climate change? The planet's climate has constantly been changing over geological time. The global average temperature today is about 15C, though geological evidence suggests it has been much higher and lower in the past. However, the current period of warming is occurring more rapidly than many past events. What is the "greenhouse effect"? The greenhouse effect refers to the way the Earth's atmosphere traps some of the energy from the Sun. The energy that radiates back down to the planet heats both the lower atmosphere and the surface. Scientists believe we are adding to the natural greenhouse effect with gases released from industry and agriculture (known as emissions), trapping more energy and increasing the temperature. Most man-made emissions of CO2 are through the burning of fossil fuels, as well as through cutting down carbon-absorbing forests.
Hurricane Sandy-level flooding is rising so sharply that it could become normal | Environment The frequency of floods of the magnitude of Hurricane Sandy, which devastated parts of New York City in 2012, is rising so sharply that they could become relatively normal, with a raft of new research laying bare the enormous upheavals already under way in the US due to climate change. These findings and two other fresh pieces of research have highlighted how the US is already in the grip of significant environmental changes driven by warming temperatures, albeit in different ways to the processes that are fueling hurricanes. An analysis of past storms and models of future events as the planet warms has shown that Sandy-like floods have become three times more common in the New York area since 1800. This frequency is set to climb further, from once every 400 years to once every 90 years by 2100, due to the effects of sea level rise alone. “Sandy was a wake-up call, and New York has been starting to do things, such as coastal defences and some mitigation.
Réchauffement climatique : La carte montrant l’influence de la hausse des témpératures sur l’économie "Un changement climatique non jugulé va probablement réduire le revenu du terrien moyen de près de 23 % en 2100, selon des estimations contenues dans une recherche publiée par la revue scientifique Nature et co-réalisée par deux professeurs de l'Université de Berkeley, en Californie", écrit le Berkeley News. Le magazine, qui publie cette carte interactive, ajoute que les recherches indiquent que le changement climatique va accroître les inégalités au niveau global, peut-être de manière dramatique, car le réchauffement est bon pour les pays froids, qui tendent à être plus riches, et plus dommageable pour les pays chauds, qui tendent à être plus pauvres.
See Earth’s Temperature Spiral Toward 2°C The steady rise of Earth’s temperature as greenhouse gases accumulate in the atmosphere and trap more and more heat is sending the planet spiraling closer to the point where warming’s catastrophic consequences may be all but assured. That metaphoric spiral has become a literal one in a new graphic drawn up by Ed Hawkins, a climate scientist at the University of Reading in the United Kingdom. The animated graphic features a rainbow-colored record of global temperatures spinning outward from the late 19th century to the present as the Earth heats up. Monthly global temperatures from 1850-2016. Credit: Ed Hawkins “The pace of change is immediately obvious, especially over the past few decades,” Hawkins, who has previously worked with Climate Central’s extreme weather attribution team, wrote in an email. The graphic is part of Hawkins’s effort to explore new ways to present global temperature data in a way that clearly telegraphs the warming trend.
COP21: Beginner's guide to the UN Paris climate summit Image copyright Getty Images What is the climate conference for? In short, the world's governments have already committed to curbing human activities such as burning fossil fuels that release the gases that interfere with the climate. But that isn't problem solved. The difficulty comes when you try to get 195 countries to agree on how to deal with the issue of climate change. Every year since 1992 the Conference of the Parties has taken place with negotiators trying to put together a practical plan of action. This year's COP21 in Paris is the last chance for this process. Critics would say the problem of climate change mustn't be that urgent if it takes 20 years to agree on a solution. But defenders argue that it's taking such a long time because decisions are taken by consensus, meaning nothing is agreed until everything is agreed. What is climate change? Six graphics that explain climate change Why does it have an odd name? Who will be attending? What are they hoping to achieve? Simple?
UK must focus on carbon removal to meet Paris goals, climate advisers urge | Environment The UK government needs to kickstart technologies to suck carbon dioxide from the air if it is to play its part in meeting the goals of the Paris climate change agreement, according to the Committee on Climate Change (CCC), the government’s official advisers. The global climate deal, which the prime minister, Theresa May, says the UK will ratify by the end of 2016, pledges net zero emissions by the second half of the century, in order to avoid the worst impacts of global warming. Given that some emissions, such as those from aviation and agriculture, will be very difficult to reduce to zero, that means removing some carbon from the atmosphere. Planting trees is the simplest solution but is limited by the land available, meaning more radical technologies need to be developed, such as chemically scrubbing CO2 from the air and burying it. Hydrogen has the advantage of using the existing gas network, but is as yet untested.
Climate change emissions footprint calculator Since February, countries have been publishing their plans for cutting greenhouse gas (GHG) emissions, ahead of a December UN meeting in Paris that aims to deliver a new accord on climate change... If every country keeps pumping GHGs into the environment at its current rate until 2100, the planet’s surface will warm by an average of up to 6°C, bringing about a dramatically different climate... Countries’ pledges for emissions cuts mostly cover the period between 2020 and 2030. Let's see what would happen if all these commitments are met...... Most countries have now announced plans, but some of the biggest emitters are proposing to do the least, and globally, current pledges won’t be enough to limit the temperature increase to the agreed limit of 2°C by 2100. The Paris accord due to be struck in December is supposed to ensure countries ratchet up their pledges. Even if every country met the pledges it has made to date, we would still be looking at a rise in emissions and temperatures.
UNO Sustainable development Do you know all 17 SDGs? History The 2030 Agenda for Sustainable Development, adopted by all United Nations Member States in 2015, provides a shared blueprint for peace and prosperity for people and the planet, now and into the future. At its heart are the 17 Sustainable Development Goals (SDGs), which are an urgent call for action by all countries - developed and developing - in a global partnership. They recognize that ending poverty and other deprivations must go hand-in-hand with strategies that improve health and education, reduce inequality, and spur economic growth – all while tackling climate change and working to preserve our oceans and forests. The SDGs build on decades of work by countries and the UN, including the UN Department of Economic and Social Affairs Follow DSDG on Facebook at www.facebook.com/sustdev and on X at @SustDev. Implementation Progress Please, check below information about the SDG Progress Report: SDGs Icons.