Open, free access to academic research? This will be a seismic shift. Wikipedia's Jimmy Wales will be helping ensure that the publicly funded portal promotes collaboration and engagement.

Photograph: Peter Macdiarmid/Getty My department spends about £5bn each year funding academic research – and it is because we believe in the fundamental importance of this research that we have protected the science budget for the whole of this parliament. We fund this research because it furthers human knowledge and drives intellectual, social and economic progress. In line with our commitment to open information, tomorrow I will be announcing at the Publishers Association annual meeting that we will make publicly funded research accessible free of charge to readers.
Giving people the right to roam freely over publicly funded research will usher in a new era of academic discovery and collaboration, and will put the UK at the forefront of open research. The challenge is how we get there without ruining the value added by academic publishers. Center for Scholarly Communication & Digital Curation. Comprehending the Digital Humanities.
Comprehending the Digital HumanitiesTopologyTopicsDocumentsDataFurther Research I decided to run this quick project after working a bit with the MALLET topic modeling kit from UMASS-Amherst.
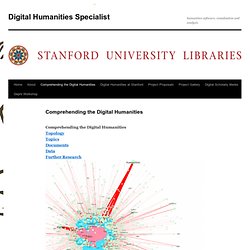
While I don’t have a background in text analysis, I found topic modeling proved extremely useful when integrated with other techniques I was more familiar with. The most interesting thing I noticed was that MALLET’s output seemed well suited for network representation. Just as with the DH@Stanford Graph, I felt that if I brought MALLET to bear on a small subject I was familiar with, it would help in my understanding the tool and technique.
For my analysis, I chose a small corpus of the Digital Humanities sub-genre of “Humanities Computing / Digital Humanities definition”. I found fifty such texts after a cursory search, followed by a few private requests as well as a quick note to the Humanist mailing list. A Companion to Digital Humanities. Data visualization. Data visualization or data visualisation is viewed by many disciplines as a modern equivalent of visual communication.
It is not owned by any one field, but rather finds interpretation across many (e.g. it is viewed as a modern branch of descriptive statistics by some, but also as a grounded theory development tool by others). It involves the creation and study of the visual representation of data, meaning "information that has been abstracted in some schematic form, including attributes or variables for the units of information".[1] A primary goal of data visualization is to communicate information clearly and efficiently to users via the information graphics selected, such as tables and charts. Effective visualization helps users in analyzing and reasoning about data and evidence. It makes complex data more accessible, understandable and usable. Data visualization is both an art and a science. Overview[edit] Indeed, Fernanda Viegas and Martin M. Graphics reveal data.
Terminology[edit] 10 Reasons Why We Visualise Data. Digital humanities. Understanding Information Architecture by Peter Morville on Prezi. THATCamp. THATCamp (The Humanities and Technology Camp) is a user-generated unconference for technologists and humanities professionals, including university and college faculty, librarians and archivists, and museum staff.
Participants set the agenda for work and discussion on the fly, in the manner of a BarCamp. [1][2] The THATCamp concept was founded at the Center for History and New Media at George Mason University in 2008. In August, 2009, the first THATCamp held outside of the George Mason campus took place at the University of Texas in conjunction with the annual meeting of the Society of American Archivists.[3] The organizers of THATCamp Austin shared information on how they organized the conference, which served as motivation for the rapid development of additional regional meetings.[4] By March, 2010 demand for assistance was great enough that CHNM received a grant from the Andrew W. See also[edit] References[edit] External links[edit] Data mining. Data mining is the process of discovering patterns in large data sets involving methods at the intersection of machine learning, statistics, and database systems.[1] Data mining is an interdisciplinary subfield of computer science and statistics with an overall goal to extract information (with intelligent methods) from a data set and transform the information into a comprehensible structure for further use.[1][2][3][4] Data mining is the analysis step of the "knowledge discovery in databases" process or KDD.[5] Aside from the raw analysis step, it also involves database and data management aspects, data pre-processing, model and inference considerations, interestingness metrics, complexity considerations, post-processing of discovered structures, visualization, and online updating.[1] Etymology[edit] In the 1960s, statisticians and economists used terms like data fishing or data dredging to refer to what they considered the bad practice of analyzing data without an a-priori hypothesis.