
Learn R. Upload mybringback.com mybringback Loading...
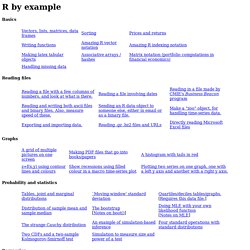
Working... Quick-R: Home Page. Code School - Try R. Coursera - Free R Progamming Course. Swirl: Learn R, in R. An R Introduction to Statistics. Introductory R Presentation. R by example. Basics Reading files Graphs.
What is R? During the last decade, the momentum coming from both academia and industry has lifted the R programming language to become the single most important tool for computational statistics, visualization and data science.

Worldwide, millions of statisticians and data scientists use R to solve their most challenging problems in fields ranging from computational biology to quantitative marketing. R has become the most popular language for data science and an essential tool for Finance and analytics-driven companies such as Google, Facebook, and LinkedIn. Watch this 90 second video for an introduction to R This video is free to download, remix and share! Every data analysis technique at your fingertips R includes virtually every data manipulation, statistical model, and chart that the modern data scientist could ever need.
Home - RStudio. Machine learning. R Programming - Manuals. Big Data, Machine Learning, and the Social Sciences. Introductory R Presentation. Deep Learning in a Nutshell. 29 December 2014 Deep learning.
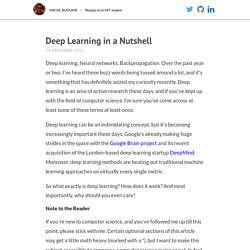
Neural networks. Backpropagation. Over the past year or two, I've heard these buzz words being tossed around a lot, and it's something that has definitely seized my curiosity recently. Deep learning is an area of active research these days, and if you've kept up with the field of computer science, I'm sure you've come across at least some of these terms at least once. Deep learning can be an indimidating concept, but it's becoming increasingly important these days. So what exactly is deep learning? Note to the Reader If you're new to computer science, and you've followed me up till this point, please stick with me. The timeline of statistics. ‘Study the past if you would define the future’ - Confucius.
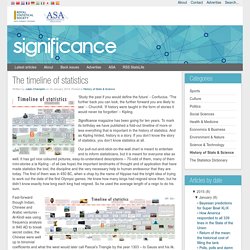
‘The further back you can look, the further forward you are likely to see’ – Churchill. ‘If history were taught in the form of stories it would never be forgotten’ – Kipling. Significance magazine has been going for ten years. To mark its birthday we have published a fold-out timeline of more or less everything that is important in the history of statistics. And as Kipling hinted, history is a story. Learn R. R Sites. Statistics. Multiple linear regression. R for Public Health. Statistics with R, and open source stuff (software, data, community) Data Sets. Nuts and Bolts of Quantstrat, Part I. Recently, I gave a webinar on some introductory quantstrat.
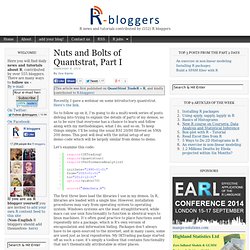
Here’s the link. So to follow up on it, I’m going to do a multi-week series of posts delving into trying to explain the details of parts of my demos, so as to be sure that everyone has a chance to learn and follow along with my methodologies, what I do, and so on. To keep things simple, I’ll be using the usual RSI 20/80 filtered on SMA 200 demo. This post will deal with the initial setup of any demo–code which will be largely similar from demo to demo. Let’s examine this code: The first three lines load the libraries I use in my demos. The next three lines, dealing with dates, all have separate purposes. The initDate variable needs a date that must occur before the start of data in a backtest. The from and to variables are endpoints on the data that the demoData.R script will use to fetch from yahoo (or elsewhere).
In some cases, I may write the code: This just sets the current to date to the time that I run the demonstration. Forecasting: principles and practice. Welcome to our online textbook on forecasting.
This textbook is intended to provide a comprehensive introduction to forecasting methods and to present enough information about each method for readers to be able to use them sensibly. We don’t attempt to give a thorough discussion of the theoretical details behind each method, although the references at the end of each chapter will fill in many of those details. The book is written for three audiences: (1) people finding themselves doing forecasting in business when they may not have had any formal training in the area; (2) undergraduate students studying business; (3) MBA students doing a forecasting elective. We use it ourselves for a second-year subject for students undertaking a Bachelor of Commerce degree at Monash University, Australia. For most sections, we only assume that readers are familiar with algebra, and high school mathematics should be sufficient background.
R Programming - Manuals. R Graph Catalog. Interpreting regression coefficient in R. Linear models are a very simple statistical techniques and is often (if not always) a useful start for more complex analysis.
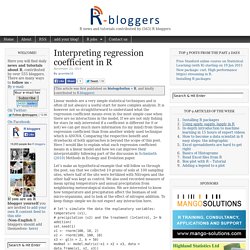
It is however not so straightforward to understand what the regression coefficient means even in the most simple case when there are no interactions in the model. If we are not only fishing for stars (ie only interested if a coefficient is different for 0 or not) we can get much more information (to my mind) from these regression coefficient than from another widely used technique which is ANOVA. Comparing the respective benefit and drawbacks of both approaches is beyond the scope of this post.
Commodity Prices - Price Charts, Data, and News - IndexMundi. Click on a commodity from the list on the left to view its full price history Related News Bunge Limited - An Unattractive Bet On World Commodities Seeking Alpha - 7/19/2016 7:48:55 AM Depite having a diversified product line, the company has suffered over the past few years as a result of decreasing commodity prices.

The company is really a bet on the world's commodity prices, and the uncertainty surrounding the issue makes the stock a ... Futures lower, but Goldman and J&J earnings limit drop Reuters - 7/19/2016 12:06:37 PM U.S. stock index futures were lower on Tuesday, mirroring global stocks, amid a dip in oil prices and as Netflix's weak report threatened to dent optimism about the earnings season. * However, the futures were off their lows after Dow components Goldman ... Learn R. Download Data - Crude Oil Prices: West Texas Intermediate (WTI) - Cushing, Oklahoma (DCOILWTICO) Data is beautiful, data is a story. MRAN - Managed R Archive Network · Getting Started with R. R-related. R Sites. R Tutorial — R Tutorial. Beginner's guide to R: Introduction. R is hot.
Whether measured by more than 4,400 add-on packages, the 18,000+ members of LinkedIn's R group or the close to 80 R Meetup groups currently in existence, there can be little doubt that interest in the R statistics language, especially for data analysis, is soaring. Why R? It's free, open source, powerful and highly extensible. "You have a lot of prepackaged stuff that's already available, so you're standing on the shoulders of giants," Google's chief economist told The New York Times back in 2009. Because it's a programmable environment that uses command-line scripting, you can store a series of complex data-analysis steps in R. That also makes it easier for others to validate research results and check your work for errors -- an issue that cropped up in the news recently after an Excel coding error was among several flaws found in an influential economics analysis report known as Reinhart/Rogoff.
Sure, you can easily examine complex formulas on a spreadsheet. Code School - Try R. Swirl: Learn R, in R. An R Introduction to Statistics. Quick-R: Home Page. Why R is Hard to Learn. By Bob Muenchen R has a reputation of being hard to learn. Some of that is due to the fact that it is radically different from other analytics software. Some is an unavoidable byproduct of its extreme power and flexibility. And, as with any software, some is due to design decisions that, in hindsight, could have been better. If you have experience with other analytics tools, you may at first find R very alien. Learn R.
R Statistical Software. Data Management. Shiny: R made interactive @ useR! 2014. At useR! 2014, one of the most anticipated presentations was Joe Cheng’s Shiny: R made interactive. It was but one of the of a fantastic series of talks by RStudio representatives; check out Winston Chang’s ggvis: Interactive graphics in R for another great talk. R Graph Catalog. Coursera - Free R Progamming Course. Statistical Learning. About This Course This is an introductory-level course in supervised learning, with a focus on regression and classification methods. The syllabus includes: linear and polynomial regression, logistic regression and linear discriminant analysis; cross-validation and the bootstrap, model selection and regularization methods (ridge and lasso); nonlinear models, splines and generalized additive models; tree-based methods, random forests and boosting; support-vector machines.
Some unsupervised learning methods are discussed: principal components and clustering (k-means and hierarchical). This is not a math-heavy class, so we try and describe the methods without heavy reliance on formulas and complex mathematics. We focus on what we consider to be the important elements of modern data analysis. The lectures cover all the material in An Introduction to Statistical Learning, with Applications in R by James, Witten, Hastie and Tibshirani (Springer, 2013). DataVisualization.