
David McCandless: The beauty of data visualization. Marketing: Why Data Visualization Is Important for a Brand. Mapping Information - Britain From Above - BBC. Air Traffic over Britain - Britain From Above - BBC. (1) Facebook. 51 Tools. Chart selection 1.
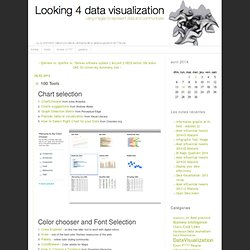
ChartChooser from Juice Analytics2. Charts suggestions from Andrew Abela3. Graph Selection Matrix from Perceptual Edge4. Periodic table of visualization from Visual Literacy 5. Color chooser and Font Selection1. 4. 5. 7. 8. colrd - Create and share color inspiration with the world 9. 10. 11. Data Presentation 1. 2. 3. 4. easel.ly - Create infographics on line (beta) 5. 6. 7. slidepoint - Create Online Presentations and Slideshows that don't use Flash. Data Visualization: 20+ Useful Tools and Resources. There are plenty of cool technologies available to collect and examine data.
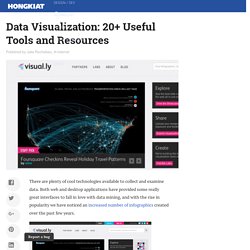
Both web and desktop applications have provided some really great interfaces to fall in love with data mining, and with the rise in popularity we have noticed an increased number of infographics created over the past few years. Today we’ll be looking into some really cool and popular online resources for data visualization. You can see all kinds of data like human population, world condition and even human emotion presented via the visualization. While some of the visualization might be experimental, all of them have one similarity: they help you understand the data better, and this is exactly what visualization is for. If you’ve designed your own infographic or visualization tool we’d love to check it out.
Recommended Reading: More Infographic related posts. Better World Flux Now this is one beautiful visualization tool! The refined condition of BWF’s design comes as no surprise. Visual.ly We Feel Fine RSS Voyage. Security - Situational awareness. 50 Great Examples of Data Visualization. Wrapping your brain around data online can be challenging, especially when dealing with huge volumes of information.

And trying to find related content can also be difficult, depending on what data you’re looking for. But data visualizations can make all of that much easier, allowing you to see the concepts that you’re learning about in a more interesting, and often more useful manner. Below are 50 of the best data visualizations and tools for creating your own visualizations out there, covering everything from Digg activity to network connectivity to what’s currently happening on Twitter. Music, Movies and Other Media Narratives 2.0 visualizes music. Liveplasma is a music and movie visualization app that aims to help you discover other musicians or movies you might enjoy. Tuneglue is another music visualization service. MusicMap is similar to TuneGlue in its interface, but seems slightly more intuitive. Digg, Twitter, Delicious, and Flickr Internet Visualizations.