
Niemann-sterotypes-custom1. Stuxnet: Anatomy of a Computer Virus. Infographics & Visualizations. Create, Share, Explore. Is Social Media Ruining Students? Infographics - Own your Information. I am a Visual Arts teacher, just so you might start to understand my next comment.
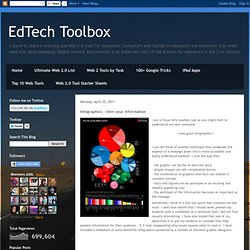
I love good Infographics ! I can not think of another technique that condenses the essence of a message down into a more accessible and easily understood medium. I love the way that; How the Internet is Revolutionizing Education. Socialcast Infographic: Adding Play Into the Enterprise. Data Visualization and Design. The Infographics Showcase - Data Visualization - Infographic Design. Infographics. A visual exploration on mapping complex networks.
The World Map of Useless Stereotypes. 50 Informative and Well-Designed Infographics. It’s impossible to comprehend complex data or analyze large amounts of information, if we only use words or texts.
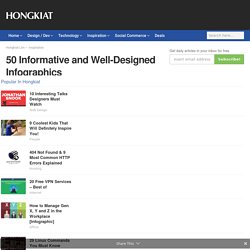
Information graphics or better known as infographics are visual explanation of data, information or knowledge. These graphics are excellent visual tools for explaining huge amounts of information where complex data needs to be explained immediately and clearly. Let me show you how Rick Mans explain how infographics ease the process of communicating conceptual information. Infographic: Meet the Tweeters.