
Getting started — tweepy 3.5.0 documentation. Introduction¶ If you are new to Tweepy, this is the place to begin.
The goal of this tutorial is to get you set-up and rolling with Tweepy. We won’t go into too much detail here, just some important basics. Hello Tweepy¶ Colourcode - find your colour scheme. Textures.js. Mike Bostock’s Blocks - bl.ocks.org. Timeline JS3 - Beautifully crafted timelines that are easy, and intuitive to use. Welcome to DataThief. Data Visualization and D3.js Course.
Lesson 1a Visualization Fundamentals (2 hours) Learn about the elements of great data visualization.
In this lesson, you will meet data visualization experts, learn about data visualization in the context of data science, and learn how to represent data values in visual form. Lesson 1b D3 Building Blocks (4 hours) Learn how to use the open standards of the web to create graphical elements. You’ll learn how to select elements on the page, add SVG elements, and how to style SVG elements. Mini-Project 1: RAW Visualization (2 hours) Create a data visualization using a software of your choice. Lesson 2a Design Principles (2 hours) Which chart type should I use for my data? Lesson 2b Dimple.js (4 hours) Learn how to create graphics using the Dimple JavaScript library. Mini-Project 2: Take Two (2-5 hours) Find an existing data visualization, critique it for what it does well and what it doesn’t do well, and finally, recreate the graphic using a software tool of your choice. Special Note. Passing data from Django to D3. Best Uses of Visual Encodings. Web Scraping with Beautiful Soup.
Recall that we want 3 things: the text of the item as it appears on the website, the URL that is linked to (so we can scrape and analyze it later), and the date the letter was sent.
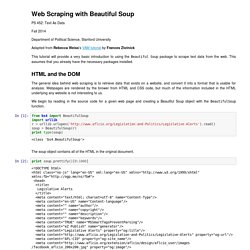
First we should consider how we are going to store this data. Since we want to maintain the association between the 3 things from each observation. A natural way to store this is as a nested dict. Dict keys must be unique, and some of our items have the same associated date, so we'll have to use one of the other items. We'll use the name. Visible text is always placed between tags. We'll go through all of the items in our letters collection, and for each one, pull out the name and make it a key in our dict.
Pocket Guide to Writing SVG. D3.js. Copyright © 2013 Scott Murray Printed in the United States of America.
O’Reilly books may be purchased for educational, business, or sales promotional use. Online editions are also available for most titles ( For more information, contact our corporate/institutional sales department: 800-998-9938 or <corporate@oreilly.com>. Nutshell Handbook, the Nutshell Handbook logo, the cover image, and the O’Reilly logo are registered trademarks of O’Reilly Media, Inc. A Fast and Powerful Scraping and Web Crawling Framework. Communicating with data. Bokeh Docs. Output Methods As we will see demonstrated frequently throughout the User Guide, there are various ways to generate output for Bokeh documents.
The most common for interactive usage are: output_file For generating simple standalone HTML documents for Bokeh visualizations. output_notebook For displaying Bokeh visualizations inline in Jupyter notebook cells. output_server For installing Bokeh applications on a running Bokeh server. These functions are most often used together with the show or save functions. Python data visualization: Comparing 7 tools. The Python scientific stack is fairly mature, and there are libraries for a variety of use cases, including machine learning, and data analysis.
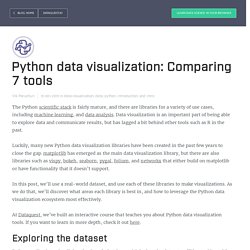
Data visualization is an important part of being able to explore data and communicate results, but has lagged a bit behind other tools such as R in the past. Luckily, many new Python data visualization libraries have been created in the past few years to close the gap. matplotlib has emerged as the main data visualization library, but there are also libraries such as vispy, bokeh, seaborn, pygal, folium, and networkx that either build on matplotlib or have functionality that it doesn’t support. In this post, we’ll use a real-world dataset, and use each of these libraries to make visualizations. Flesch–Kincaid readability tests. The Flesch–Kincaid readability tests are readability tests designed to indicate how difficult a passage in English is to understand.
There are two tests, the Flesch Reading Ease, and the Flesch–Kincaid Grade Level. Although they use the same core measures (word length and sentence length), they have different weighting factors. The results of the two tests correlate approximately inversely: a text with a comparatively high score on the Reading Ease test should have a lower score on the Grade-Level test. Rudolf Flesch devised the Reading Ease evaluation; somewhat later, he and J. Paper.js. Paper.js allows you to interact with the keyboard in two ways: You can either intercept key events and respond to these, or you can check the state of a given key at any moment, to see if it is pressed or not.
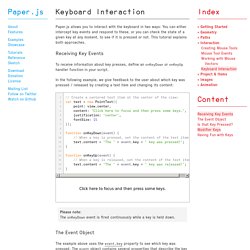
This tutorial explains both approaches. Receiving Key Events To receive information about key presses, define an onKeyDown or onKeyUp handler function in your script. In the following example, we give feedback to the user about which key was pressed / released by creating a text item and changing its content: Please note: The onKeyDown event is fired continuously while a key is held down. The Event Object. Processing.org. Datavisualization.ch Selected Tools.
RAW.