
Video tutorial français freemind.
FREEMIND. XMIND. PEARLTREES. EX de MINDMAPS. DEFINITION MINDMAP. Veille de Silvae sur Diigo. What Your Business Needs to Know About Social Graphs - Jeff Korhan - New Media and Small Business Marketing. Géographie des réseaux sociaux : approches cartographiques. La culture de l’information en cartes… pour mieux la différencier de l’information literacy. Les récents débats autour du Pacifi, qui privilégie davantage une position proche de l’information literacy dans ses principes premiers, et la démarche de culture de l’information qui présente des liens mais aussi des divergences peuvent être parfaitement illustrés et expliqués par des cartes mentales.
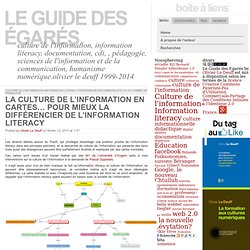
Ces cartes sont issues d’un travail réalisé par des M1 de l’université d’Angers suite à mes interventions sur la culture de l’information à la demande de Pascal Duplessis. Il s’agit aussi pour moi de bien marquer le fait qu’information literacy et culture de l’information ne peuvent être nécessairement synonymes. L’Infographicus Foirus. Démasqué, Disséqué, empaillé. Depuis 2 ans, on voit les infographies (infographics) se multiplier sur Internet.
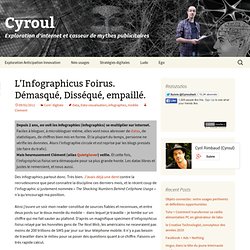
Faciles à bloguer, à microbloguer même, elles vont nous abreuver de datas, de statistiques, de chiffres bien mis en forme. Et la plupart du temps, personne ne vérifie les données. Alors l’infographie circule et est reprise par les blogs pressés (de faire du trafic).Mais heureusement Clément (alias Quietglover) veille. Et cette fois, l’infographicus foirus sera démasquée pour sa plus grande honte. Les datas libres et justes le remercient, et nous aussi.
Freemind : la grande INITIATION. New Book: Visual Complexity on Datavisualization. The Comprehensive Guide To House Cats. About. What is data visualization?
Data Visualization is a transversal discipline which harnesses the immense power of visual communication in order to explain, in an understandable manner, the relationships of meaning, cause and dependency which can be found among the great abstract masses of information generated by scientific and social processes. What is this website for? Datavisualization.ch is the premier news and knowledge resource for data visualization and infographics. Our mission is to provide you with the latest research findings and most topical use cases in this field – including cognitions from self initiated studies as well as a review of outstanding projects done by smart people in the community. It is also a perfect place to share your opinion and discuss interesting movements, to get inspired and ignite new ideas. How can you interact?
We’re constantly researching the field of data visualization and information graphics to find quality projects. Toolkit. The Gephi Toolkit project package essential modules (Graph, Layout, Filters, IO…) in a standard Java library, which any Java project can use for getting things done.
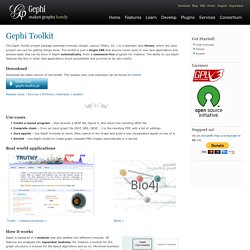
The toolkit is just a single JAR that anyone could reuse in new Java applications and achieve tasks that can be done in Gephi automatically, from a command-line program for instance. Adrianshort/Sutton-Open-Maps - GitHub. Gephi Quick Start. Daniel McLaren. Le Mind Mapping au service du SI° La sérendipité. Quelques définitions de Walpole à aujourd'hui. "Copy, paste, map" Data, data everywhere, and all too many spreadsheets to think.
Citizens have a new tool to visualize data and map it onto their own communities. Features. Gephi is a tool for data analysts and scientists keen to explore and understand graphs.
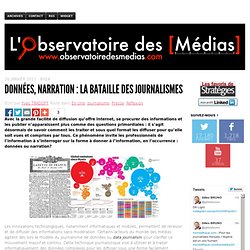
Omni Store - The Omni Group. OmniOutliner 3. Logiciels de mind mapping et outliners: antagonistes ou complémentaires? Données, narration : la bataille des journalismes. Avec la grande facilité de diffusion qu’offre Internet, se procurer des informations et les publier n’apparaissent plus comme des questions primordiales : il s’agit désormais de savoir comment les traiter et sous quel format les diffuser pour qu’elle soit vues et comprises par tous.
Mentionmap - A Twitter Visualization. Thoughtograph - Download. Ce que nous dit Houellebecq: l'humanité est obsolescente. De quoi Michel Houellebecq est-il le nom ?
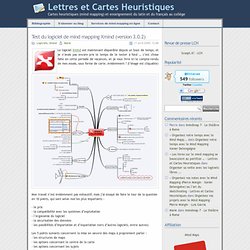
De quoi nous parle-t-il de livre en livre ? » Test du logiciel de mind mapping Xmind (version 3.0.2) - Lettres et Cartes Heuristiques. Le logiciel Xmind est maintenant disponible depuis un bout de temps, et je n’avais pas encore pris le temps de le tester à fond … c’est chose faite en cette période de vacances, et je vous livre ici le compte-rendu de mes essais, sous forme de carte, évidemment !
10 choses à savoir avant de vouloir travailler dans une bibliothèque. La carte et le réseau social » Article » OWNI, Digital Journalism. Avec l'apparition des réseaux sociaux, un nouveau type de carte est apparu, le graphe social.
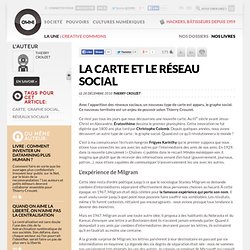
Ce nouveau territoire est un enjeu de pouvoir selon Thierry Crouzet. Ce n’est pas tous les jours que nous découvrons une nouvelle carte. Google N-Gram : des choses cachées depuis le commencement du monde. Etes-vous déjà allé tester le service Google N-Gram mis en ligne sur le GoogleLabs ? C'est assez fascinant, et c'est une belle illustration de ce que je commençais à évoquer dans mon dernier billet sur les big data. Comme l'expliquent les responsables du projet sur le blog officiel, Google vient tout simplement de mettre à la disposition des chercheurs un invraisemblable corpus. 5 millions de livres ont été numérisés soit, paraît-il, environ 4% des livres imprimés depuis l'aube de l'humanité.
Je suppose que la distribution de ces ouvrages, censément en six langues, est accessibles quelque part. La cartographie: nouvel outil de productivité. "Le principe d'une carte heuristique est de mettre le thème principal au centre de la feuille en le représentant par un mot ou un dessin puis, à partir de là, développer des branches comportant les idées forces se rapportant aux thèmes. L'intérêt de ces schémas est qu'ils permettent une grande liberté de construction et que les mots peuvent être remplacés par des images, des dessins ou des photos", résume Stéphane Seuret, auteur d'une thèse sur le mindmapping. Social local network ecosystem. Products: Google Browser. Paradoxe de Condorcet. Un article de Wikipédia, l'encyclopédie libre. Bulletin Clic - Les cartes heuristiques. Mark Butorac (Un dossier de la Vitrine Technologie-Éducation) Les cartes heuristiques, connues en anglais sous le nom de Mind Maps, sont utilisées depuis des siècles en éducation dans les sessions de remue-méninges, comme moyen mnémotechnique, à des fins d'illustration et même de gestion de crises, et ce, tant par des éducateurs, des ingénieurs, des psychologues que par la population en général.
Mon identité numérique.
Personal knowledge management with pearltrees. Fresh and Crispy: Lookback at 2010: Tool of the Year. Cartographier les délires du copyright, ça vous dit ? #pearltrees. J’avais déjà eu l’occasion d’écrire un billet sur Pearltrees, un service original de bookmarks, qui permet de « cartographier » ses parcours sur la Toile et de les organiser sous la forme d’arbres de perles. La dimension juridique de Pearltrees n’est pas très développée, mais j’avais tout de même repéré quelques belles réalisations dans ce billet et j’essaie de développer des arbres juridiques sur mon compte.
Il y a peu, une nouvelle fonctionnalité est apparue sur Pearltrees, qui apporte une dimension collaborative supplémentaire. Il est possible d’inviter d’autres utilisateurs à venir « faire équipe » pour développer un de ses propres arbres de perles. Saviez-vous qu’il existe des perles de S.I.Lex ? (Pearltrees et le droit)
Serait-ce une perle de silex ? (en fait, du silex rubané poli). Krzemień pasiasty kula.