
Chartle.net - interactive charts online! Online Charts Builder. Hohli Online Charts Builder Load From Image URL: Chart Data can't equal to original, but very similar to it.
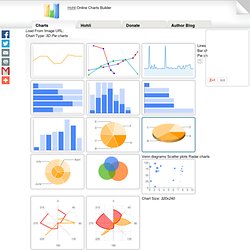
Only for images on chart.apis.google.com Chart Type: 3D Pie charts Lines Bar charts Pie charts For Pie Charts with labels choose 1000x300 or 800x375 size Venn diagrams Scatter plots Radar charts Chart Size: 320x240 Horizontal 1000x300 800x375 600x500 320x240 Vertical 300x1000 375x800 500x600 240x320 Square 546x546 400x400 300x300 200x200 Chart Ads: Data: Should be consists only positive numbers, use minus one (-1) for missing value, separated by coma, space or semi(,; ), e.g.: 23, 432, 456, 341 For Lines (pairs): Input data as x-axis and y-axis coordinates, e.g.: x1,y1, x2,y2, x3,y3 Title: Use a pipe character (|) to force a line break in title. Background: Chart is ready you can save it as image Right click on the chart Select "Save image as" Save the image to your computer or copy one of follow code (embedded or image link only) More Sharing Services.
How To Create Outstanding Modern Infographics. In this tutorial you will learn that data doesn't have to be boring, it can be beautiful!

Learn how to use various graph tools, illustration techniques and typography to make an accurate and inspiring infographic in Adobe Illustrator. Start by using the Rectangle Tool (M) to draw a shape. Give it a subtle radial gradient too. The entire design is based on a grid of four columns. To make the columns first select the rectangle and drag a guide onto the centre of the shape. Condense the shape so it fits within the left-most guide and centre guide. Move the shape over to the right and add another guide to the centre here. Using the Rectangle Tool (M) draw a thin white box on the centre line that will be the width of the gap between the columns. Repeat the process for the other columns with your final result being below. I like to place the most important graphics first and work-in the ancillary charts and graphs afterwards. Give the circles a variety of gradients. That's it! Desktop.
This software has been renamed to Gapminder World Offline Because of technical problems the software on this page is no longer being maintained!

Please visit Gapminder World Offline (Beta) instead. Gapminder Desktop With Gapminder Desktop you can show animated statistics from your own laptop! Install the free software and watch the how-to video with Hans Rosling. Install With the Gapminder World you will be able to:Use the software without internet accessSave a list of your own favorite graphsUpdate automatically to the latest version Video: “How to use Gapminder Desktop” Installation instructions (Windows, Mac and Linux) Free Data Visualization Software. 6 outils pour créer vos infographies facilement via. Les infographies ont du succès, peut être souhaitez-vous créer les vôtres ?
Des outils simples sont à disposition sur la toile. Je vous ai déjà parlé de quelques outils dans différents articles (ceux d’Intel ou de Visual.ly), voici une sélection de 5+1 outils pour utiliser et dynamiser vos données. Pick to chart Transformez vos informations en présentations hautes en couleurs. A travers une interface élégante et simple d’accès, cliquez les zones que vous souhaitez modifier et ajoutez vos données.
D’une facilité déconcertante, cet outil payant est un incontournable pour dynamiser vos supports de communications. Info.gram Sur un principe identique à PickToChart, ce service vous propose une création en 3 étapes : choix du design, import des données (CVS ou Excel) puis génération de l’infographie. Info.gram offre un large choix de gabarits à modifier. Easel.ly En un clic sur le bouton « Get started » et vous commencez déjà à remplir votre infographie ! Gliffy Geocommons. Visual.ly. Piktochart.
How to create an Infographic (in 2.5 minutes) Easel.ly. Infogr.am. 10 Awesome Free Tools To Make Infographics. Advertisement Who can resist a colourful, thoughtful venn diagram anyway?

In terms of blogging success, infographics are far more likely to be shared than your average blog post. This means more eyeballs on your important information, more people rallying for your cause, more backlinks and more visits to your blog. In short, a quality infographic done well could be what your blog needs right now. Designing An Infographic Some great tips for designing infographics: Keep it simple! Ideas for infographic formats include: Timelines;Flow charts;Annotated maps;Graphs;Venn diagrams;Size comparisons;Showing familiar objects or similar size or value. Here are some great tutorials on infographic creation: Creating Your Infographic Plan and research.If required, use free software to create simple graphs and visualisations of data.Use vector graphic software to bring these visualisations into the one graphic.
Free Online Tools For Creating Infographics Stat Planet Hohli Creately New York Times Many Eyes Wordle. Diagram Software to draw Flowcharts, UML & more Online.