
Cool Infographics - Cool Infographics. Cool infographic video from the team at Adobe that shares the results of their own 2012 Digital Video Benchmark research. As you relax at home, walk through stores, and sit in airports, you see people watching video on more screens than ever before. But don’t rely on the eyeball test. The Adobe Digital Index team looked at 19.6 billion video starts on media websites to confirm the growth of broadcast video consumption across connected devices.
See the latest video trends they uncovered for device use, ad placement, social media, and more. Learn more about what they found here: Digital Index publishes research on digital marketing based on the analysis of anonymous, aggregated data from over 5,000 companies worldwide that use Adobe Marketing Cloud. The information is about all videos and ad placements in online videos, but the data also applies to infographic videos.
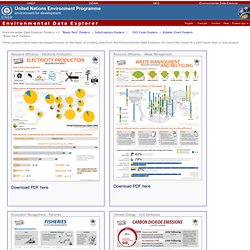
Clean data visualizations that I would assume were created in Adobe After Effects. ReMap. Contest: Create an Infographic About Haiti. 50 great examples of infographics - FrancescoMugnai.com - Graphi. Financial Infographics, Savings Account & CD Rates - VisualEcono. GEO Data Portal - The Environmental Database (search. United Nations Environment Programme environment for development Environmental Data Explorer English | Français | Contact | Help | System sign in Environmental Data Explorer Posters >> "Basic Fact" Posters | InfoGraphics Posters | ISO Code Posters | Bubble Chart Posters "Basic Fact" Posters These posters have been developed mainly on the basis of existing data from the Environmental Data Explorer.

Resource Efficiency - Electricity Production Download PDF here Resource Efficiency - Waste Management Download PDF here Ecosystem Management - Fisheries Download PDF here Climate Change - CO2 Emissions Download PDF here Ecosystem Management - Forests Download PDF here Environmental Governance - Treaties Download PDF here Resource Efficiency - Electricity Consumption Download PDF here Ecosystem Management - Protected Areas Download PDF here Harmful Substances - Hazardous Waste Download PDF here Infographic Posters GEO Indicators Download PDF here Recycling Download PDF here Access to Safe Drinking Water Flows of GDP & CO2. Infographic Coins « petitinvention.
The round shaped coins must have a lot of benefits that other figures such as a triangle or a square don’t.

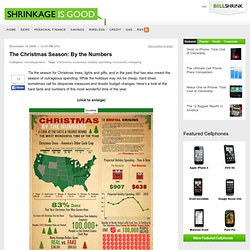
Also, non-rounded coins may have many demerits. Aside from those, travelers and other people who are not accustomed to the currency would be able to easily remember how much each of these coins is (as long as she knows how to read pie charts). This work is licensed under aCreative Commons Attribution 3.0 Unported License. Like this: Like Loading... The Christmas Season: By the Numbers. ‘Tis the season for Christmas trees, lights and gifts, and in the past that has also meant the season of outrageous spending.

While the holidays may not be cheap, hard times sometimes call for desperate measures and drastic budget changes. Here’s a look at the hard facts and numbers of this most wonderful time of the year. (click to enlarge) Embed the above graphics on your blog: <a title="Christmas Spending Numbers" href=" src=" alt="Christmas Spending Numbers" width="500" /></a></p><p><small>Find the best <a href=" phone plans</a> and more graphics at BillShrink.com</small> Check out our other holiday guides:2009 Holiday Smartphone GuideThe Best Credit Cards for the Holidays.
Digital Podge 2009 - Measurable Fun. Digital Podge 2009 17th December 2009 Swedish Podge 2010. Ideas, issues, concepts, subjects - v. Create Flowchart, Org Chart and Network Diagram Easily with Edra.