
Territoire - Région de naissance, région de domicile - Cartes interactives - Région de naissance, région de domicile - Cartes interactives. La population urbaine mondiale de 1950 à 2050 - carte statistique interactive de l'UNICEF. Bruit.agglo-tours.fr. Global Population Density at a Glance (Infographic) Fathom Information Design/Promo image This population density map is making the rounds on the blogs today, to near-universal acclaim. And for good reason; it might be the most intuitive look at global pop. density ever cobbled together. The brainchild of Fathom Information Design, 'Dencity' uses small pixels to connote density, big ones to convey wide-open, unpopulated spaces. Fast Company explains why the design works: In the visual syntax of infographics and maps, bigger equals... well, bigger. Fathom Information Design/Promo image I don't really get what's so unorthodox about this; to me, it seems downright intuitive. China. Counterintuitive or not, it is indeed a brilliantly effective way to convey where population centers are grouped, and where there's still free range.
Click here to view a larger image. Regional Disparities in Brazil. Enseigner l'Histoire-Géographie. Flood Map Water Level Elevation Map. Urbanisation. BBC - Dimensions - La carte du fleuve / Accueil - Le site portail du Fleuve Rhône. Ceriscope. Atlas of Urban Expansion. Massive urbanization, accompanied by the rapid expansion of cities and metropolitan regions and the sprawling growth of megacities the world over, is one of the most important transformations of our planet.
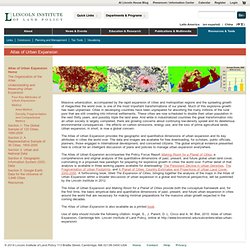
Much of this explosive growth has been unplanned. Cities in developing countries have been unprepared for absorbing the many millions of the rural poor that are still crowding into informal settlements. These cities are now scheduled to double their urban population in the next thirty years, and possibly triple the land area. And while in industrialized countries the great transformation into an urban society is largely completed, there are growing concerns about continuing low-density sprawl and its deleterious environmental consequences - the effects on carbon emissions, energy use, and the loss of prime agricultural lands.
Urban expansion, in short, is now a global concern. The Atlas of Urban Expansion is also available as a printed book. Flight & Expulsion. Rankings & Results « Vision of Humanity. Through See the latest peace news and research Contact us Vision of Humanity is an initiative of the Institute for Economics and Peace (IEP).

IEP have offices in New York and Sydney. For more specific inquiries related to the peace indexes and research, please contact IEP directly. Media: media@economicsandpeace.org Education: educators@economicsandpeace.org Data request: info@economicsandpeace.org Sydney office PO Box 42, St Leonards, NSW 1590, Sydney Australia Tel: +61 2 9901 8500 New York office 3 East 54th Street 14th Floor New York, New York 10022 USA Tel: +1 (646) 963-2160 Job opportunities and internships are listed on the Institute for Economics and Peace website. Les 52 projets d'avenir financés par le grand emprunt. Les blonds en Europe. Détails Création : 21 juillet 2010 Parce que cette information est sans importance, elle devient donc fondamentale !
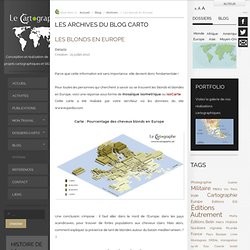
Pour toutes les personnes qui cherchent à savoir où se trouvent les blonds et blondes en Europe, voici une réponse sous forme de mosaïque isometrique ou isoCarte.Cette carte a été réalisée par votre serviteur via les données du site www.eupedia.com. Carte : Pourcentage des cheveux blonds en Europe Une conclusion s'impose : il faut aller dans le nord de l'Europe, dans les pays scandinaves, pour trouver de fortes populations aux cheveux clairs.
EuroMéditerranée. Flight & Expulsion. Global 500 2010: Maps - Top 500. Companies are ranked by total revenues for their respective fiscal years ended on or before March 31, 2015.

All companies on the list must publish financial data and report part or all of their figures to a government agency. Figures are as reported, and comparisons are with the prior year’s figures as originally reported for that year. Fortune does not restate the prior year’s figures for changes in accounting. Revenues Revenue figures include consolidated subsidiaries and reported revenues from discontinued operations, but exclude excise taxes. Profits Profits are shown after taxes, extraordinary credits or charges, cumulative effects of accounting changes, and noncontrolling (minority) interests, but before preferred dividends. Balance Sheet Assets shown are those at the company’s fiscal year-end. Global 500 2010: Maps - Top 500. Flux2. Présentation le monde bilan planete - une vidéo Campus.