
Home » The Hub. Active Lives Survey. 2018 Second annual report to parliament on Sporting Future. Sector and region economic insights. Active Lives Adult Report May 16 17 Sport England. Active lives survey yr 1 report. Youth 2000 publications. Families and Whanau Status Report 2016 Superu. Research & evidence about what works for families & whanau. Growing Up in New Zealand is a longitudinal study.
The cohort is broadly generalisable (ethnicity and social-economic status) to contemporary New Zealand. The purpose of the study is to provide evidence about what shapes children’s early development so every New Zealand child can have the best start in life. The study started in 2008 and is funded by the government. It is based at the University of Auckland’s Centre for Longitudinal Research – He Ara ki Mua and the contract for the study has been managed by Superu since 2013.
Family wellbeing in Wellington. Physical activity across life stages. Why a thriving brain needs a lifetime of exercise. We don't give much thought to exercising for the sake of our brains (at least not until we're old enough to worry about Alzheimer's).
But there's growing evidence that brains thrive on regular physical activity all the way from childhood to old age, say researchers at Deakin University's Institute for Physical Activity and Nutrition. Childhood and adolescence may turn out to be critical for influencing brain health in later life, says Dr Helen Macpherson whose recent review of research linking physical activity to brain health was published in Frontiers in Ageing Neuroscience. although we need more research to determine this.
"Physical activity in the early years may set up long term behaviours that promote healthier brains over the lifespan. At any age it may be important to consider the benefits of a healthy lifestyle for maintaining a healthy brain, rather than focusing on the impact on our waistlines," she points out. Get the latest news and updates emailed straight to your inbox. Royal Society Te Aparangi - Our expert advice papers. Health and Wellbeing Benefits of Swimming 2017 Report (UK) Growing Up in New Zealand - Growing Up in New Zealand. 2013 Census – New Zealand as a village of 100 people.
Why is the data in this infographic different to data in other 2013 census products?
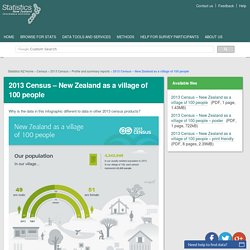
Why is the data in this infographic different to data in other 2013 census products? Data presented in this infographic may be different to data in other 2013 Census products. For example, the number of Māori in the village of our infographic is 14, whereas 2013 Census QuickStats about national highlights states 14.9 percent of people in New Zealand are of Māori ethnicity. In the infographic, we used the total census usually resident population count (‘total count’) to calculate percentages about the villagers. This total count includes all people who have not stated an answer or whose answer was unable to be allocated to a specific category. Why do some sections of the infographic refer to 80 people, not 100? Research. The research activities and outcomes as well as news items are within each of the themes below.
Blog. Sport for Life Society - Improving Quality of Sport and Physical Literacy in Canada. The Wellington Region. 2013 Census QuickStats about culture and identity. Ethnic group profiles. 2013 Census ethnic group profiles provide an overview of the different ethnic groups living in New Zealand.
Get information on topics such as population and geography, birthplace, education, and housing. Data is available for all ethnic groups that have a population of at least 100 people. Ethnicity definition An ethnic group is made up of people who have some or all of the following: a shared culture, such as traditions, customs, beliefs, or language a common ancestry or history a similar geographic, tribal, or clan origin.
The census asks people to state the ethnic group or groups they belong to. Podcasts : News and Media. Porirua Statistics and Monitoring - Porirua City Council, New Zealand. We're making our City amazing. This section describes the wide range of statistical information and profiles on Porirua from external and internal sources.
As well as publishing this information for use by the public, it is used by the Council to inform its planning processes and to monitor the progress the city is making. The information sources are listed below, along with other web site links relevant to Porirua. Porirua City Quarterly Economic Monitor Produced by Infometrics, the Quarterly Economic Monitor provides an in-depth description of Porirua’s economic performance. It monitors quarterly statistics on GDP, traffic, consents, house prices, house sales, guest nights, retail sales, vehicle registrations, unemployment rates, migration and jobseeker numbers. Porirua City Economic Profile Produced by Infometrics, the Economic Profile gives insight into Porirua's economic structure and performance over the past year and previous years. Royal Society Te Aparangi - Our expert advice papers. Homepage - Te Kete Ipurangi (TKI)
My Life, My Council. Sport England. Sport Market Insights - Market Segmentation. The State of the State. 2013 Census. Skills Active Sport & Recreation Industries Workforce Scan 2016 (paid & volunteer) Insights - The New Zealand Herald. Insights - based on projections data Whau Local Board area will see its proportion of European population decline from 68 percent in 1996 to 31 percent in 2038.
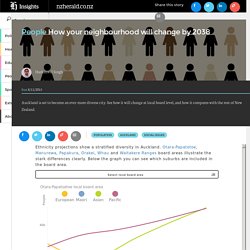
It includes the suburbs of New Lynn, Green Bay, Kelston, Rosebank, Avondale, New Windsor and Blockhouse Bay. Manurewa local board area will see a decline of European population from 62 percent in 1996 to 17 percent in 2038, while the Pacific population rises from 20 percent to 62 percent in the same period. Wellington will see the Asian population rise from 9 percent in 1996 to 24 percent in 2038. Only Auckland will have more Asian population.
Stratified diversity Diversity is never equally distributed, for reasons including history, immigration and socio-economic patterns. Our Futures « 2014 « Papers « Expert Advice. Our Futures: Te Pae Tawhiti The Royal Society of New Zealand has undertaken a major review of the rapidly changing New Zealand population, and the implications of this for the economy, social cohesion, education, and health.
Its purpose is to promote informed discussion of the implications of the 2013 New Zealand Census for understanding the changing nature of New Zealand society. Ko te pae tata, whakamaua, kia tīnā, Ko te pae tawhiti, whaia, kia tata – Secure the horizons that are close to hand and pursue the more distant horizons so that they may become close Our Futures panel chair Professor Gary Hawke FRSNZ explains the purpose and process of the report and shares some of the key findings.
Sport Science Infographics by @YLMSportScience. Federation University and Victoria University. Centre for Sport and Social Impact. Institute of Sport, Exercise and Active Living (ISEAL) Education Counts. Education Counts. Koordinates - create informative maps. Statistics NZ Stat Maps. Explore and visualise statistics about New Zealand and its people in map form.
Visit often, as we plan to release more statistical maps that visualise changes in our society, economy, and environment. Check out our maps in one of these categories: Statistics NZ data service prototype - The Statistics NZ data service prototype provides an easy-to-use platform to search, browse, and download the 2016 geographic boundaries. Participation in physical activity. Most recent dataThe graphs below are interactive.
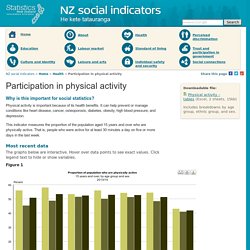
Hover over data points to see exact values. Click legend text to hide or show variables.Figure 1See information about this data.Figure 2 Information about the dataFigures 1 and 2 Date published: December 2014 Next update expected: December 2015 Update frequency: Annually Specific classification used: ‘Physically active’, as calculated from answers to the New Zealand Physical Activity Questionnaire Short Form questions. Physical activity is calculated as: time respondents spent brisk walking + time spent doing moderate-intensity activity + (2x time spent doing vigorous activity).
Clearinghouse : Knowledge Base. Wellington Regional Council: Genuine Progress Index. New Zealand Secondary Schools Sports Council - NZSSSC Census Reports. NZSSSC Representation Census 2015 Many thanks to everybody in schools and in RSD offices who assisted in this exercise; without you this invaluable data would not be available for the benefit of national bodies, regional sports development personnel, schools and, not least, you the provider. Your contribution has allowed us to gather the data that shows just how large and how important the secondary schools sports sector is.
Active Living Research. Obesity data downloadables.
Policies & Guidelines. Future scenarios and Trends to watch. Measuring Sport Participation. International data, trends and evidence.