
Measurement Levels of Data. Next: Summarizing Categorical Data Up: Data Presentation Previous: Statistics and Data It is useful to distinguish between four levels of measurements for data, from weakest to strongest: 1.
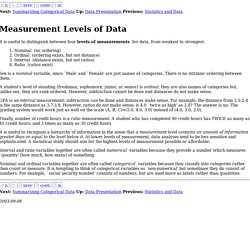
Nominal (no ordering) 2. Ordinal (ordering exists, but not distance) 3. Interval (distance exists, but not ratios) 4. Sex is a nominal variable, since `Male' and `Female' are just names of categories. A student's level of standing (freshman, sophomore, junior, or senior) is ordinal; they are also names of categories but, unlike sex, they are rank-ordered. GPA is an interval measurement; subtraction can be done and distances make sense. Finally, number of credit hours is a ratio measurement. It is useful to recognize a hierarchy of information in the sense that a measurement level contains an amount of information greater than or equal to the level below it. 40 MULTIPLE CHOICE QUESTIONS IN BASIC STATISTICS. Statistics Quizzes, Trivia, Questions & Answers - ProProfs Quizzes.
Statistics-Chapter 11-Correlated Groups t Test flashcards. Ps217.htm. PS 217 - Statistics I Copies of old exams in pdf format (need to have Adobe Acrobat Reader to open): *NB - Exams prior to 2008 use StatView for analysis, with older exams using an older version of StatView, which produces source tables and means tables that may differ from those produced by the more recent version of StatView.
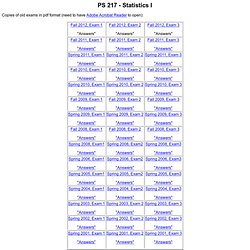
And, of course, both versions of StatView produce output the may differ substantially from that produced by SPSS/PASW. And, beginning in Fall 2009, SPSS has become PASW. Ahhh, as of 2010, it's now back to SPSS. Free Statistics Online Practice Tests. Untitled. Problem 1 In one state, 52% of the voters are Republicans, and 48% are Democrats.
In a second state, 47% of the voters are Republicans, and 53% are Democrats. Statistics practice tests. IB Psychology: Descriptive statistics quiz. Rice Virtual Lab in Statistics (RVLS) Copyright © 1993-2006 David M.
Lane Partial support for this work was provided by the National Science Foundation's Division of Undergraduate Education through grant DUE 9751307. Any opinions, findings, and conclusions or recommendations expressed in this material are those of the author(s) and do not necessarily reflect the views of the National Science Foundation. Last updated: 3/1/108 Permissions Permission is granted to link to any portion of the Rice Virtual Lab. The applets in the simulations/demonstrations are hereby in the public domain and can therefore be used without restriction. If you wish to copy and/or distribute any portion of the Case Studies, or the Analysis Lab, please contact David Lane. IBM® SPSS® Statistics Student Version 18.0 for Windows and Mac OS X: Inc. SPSS Inc.: 9780321675378: Amazon.com. Statistical Variance and Margin of Error. LISA Short Course: Regression Analysis Using JMP.
WebMath - Solve Your Math Problem. ANOVA Table - Exercise - Learning Ace - 1. Interactive Excel Spreadsheets. Developer's Guide to Excelets: Dynamic and Interactive Visualization with "Javaless" Applets or Interactive Excel Spreadsheets Excelets are interactive Excel spreadsheets or simulations of mathematical models.
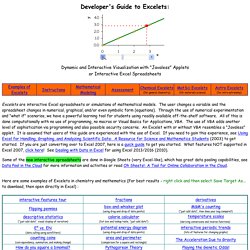
The user changes a variable and the spreadsheet changes in numerical, graphical, and/or even symbolic form (equations). Calculators and Tools. Order of Operations - PEMDAS. Statistics Lessons. AP Statistics Practice Test. WARNING: Your browser does not support Javascript.
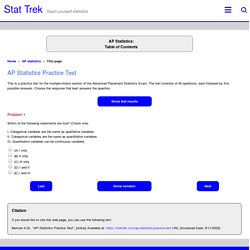
As a result, some features on this page (e.g., the Timer, the Test Performance Monitor, the command buttons) will not work. There is some good news. Introductory Statistics Practice Quiz. Before you begin a statistics course, you may want to get an idea of what you know and what you need to learn.

The test will answer some of these questions for you. The test consists of 50 multiple-choice questions covering the topics in this book. Although 50 questions can't cover every concept, skill, or shortcut taught in this book, your performance on the test will give you a good indication of your strengths and weaknesses. Keep in mind, the test does not test all the skills taught in this statistics book. If you score high on the test, you have a good foundation and should be able to work your way through the book quickly.
Take as much time as you need to do the test. Quiz The time it takes an employee to drive to work is the variable of interest. Statistics practice test 1. Descriptive Stats Exercises. Elementary Statistics and Probability Tutorials and Problems. QELP Practice Data Page. One-Sample T-Test. It is perhaps easiest to demonstrate the ideas and methods of the one-sample t-test by working through an example.
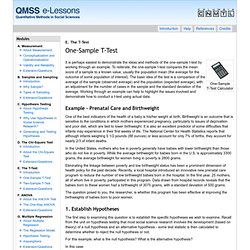
To reiterate, the one-sample t-test compares the mean score of a sample to a known value, usually the population mean (the average for the outcome of some population of interest). The basic idea of the test is a comparison of the average of the sample (observed average) and the population (expected average), with an adjustment for the number of cases in the sample and the standard deviation of the average. Working through an example can help to highlight the issues involved and demonstrate how to conduct a t-test using actual data. Hand Calculation of ANOVA - Hand Calculation of ANOVA.pdf. ANOVA Table - Exercise - Learning Ace - 1. Methods Manual: t-test independent, hand calculation.