
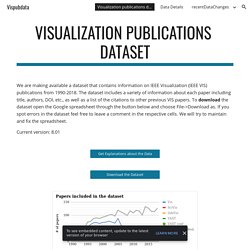
Vispubdata. If you use this dataset or the image above we would appreciate a citation.
ViziCities - See your city in revolutionary ways. Interactive Map of Belarusian History. All The Productivity Tips You Need In 9 Infographics. Ever notice how some people come across as having their act together? They are able to get their work done on time, every time. They have the time and energy for 100 different things. Yet, they always seem non-frazzled, non-overwhelmed, and non-frantic. Do you console yourself with the thought that these are a special breed of people with a special DNA sequence? Perceptual Edge - Examples. 3 Representational Models That Affect Usability.
A few weeks ago while talking about visual perception and memory, I mentioned how the mental models your audience hold affect how they perceive your designs.
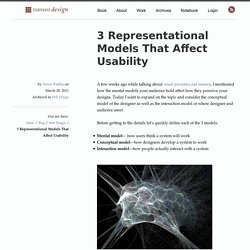
Today I want to expand on the topic and consider the conceptual model of the designer as well as the interaction model or where designer and audience meet. Before getting to the details let’s quickly define each of the 3 models. Mental model— how users think a system will workConceptual model—how designers develop a system to workInteraction model—how people actually interact with a system Mental Models A mental model represents a persons thought process for how something works. We all use mental models to predict how systems work.
Christopheviau. 50 Great Examples of Data Visualization. Wrapping your brain around data online can be challenging, especially when dealing with huge volumes of information.

And trying to find related content can also be difficult, depending on what data you’re looking for. But data visualizations can make all of that much easier, allowing you to see the concepts that you’re learning about in a more interesting, and often more useful manner. Below are 50 of the best data visualizations and tools for creating your own visualizations out there, covering everything from Digg activity to network connectivity to what’s currently happening on Twitter. Music, Movies and Other Media Narratives 2.0 visualizes music. Liveplasma is a music and movie visualization app that aims to help you discover other musicians or movies you might enjoy.
Tuneglue is another music visualization service. MusicMap is similar to TuneGlue in its interface, but seems slightly more intuitive. Digg, Twitter, Delicious, and Flickr Internet Visualizations. 20 Great Visualizations of 2011. As the popularity of visualizations grows, so does their range and quality.
Here’s a list of 20 of the best Static Visualizations, Interactive Visualizations, and Information Videos from 2011. (Note: while they are numbered for your convenience, the entries are not ranked.) Static Visualizations Often, static infographics are created without much thought, just as fodder to get clicks on the web. The Ultimate Guide to Biking and Cycling [INFOGRAPHIC] Biking's a total blast, but how do you get started or push to the next level?
![The Ultimate Guide to Biking and Cycling [INFOGRAPHIC]](http://cdn.pearltrees.com/s/pic/th/ultimate-infographic-greatist-64854742)
We’ve got all you need to know (including three workout plans!) For any rider, beginner to pro. Illustration by Laura Culhane. Text by Sarah Koppelkam. Want to learn more? TheWorldas100People_519247ce0980d_w1500.png (JPEG Image, 1500 × 1500 pixels) - Scaled (66%) The Ultimate Guide to Biking and Cycling [INFOGRAPHIC] Visualization Gallery - CS294-10 Visualization Sp11. CS294-10 Visualization - CS294-10 Visualization Sp11. From CS294-10 Visualization Sp11 Visual media are increasingly generated, manipulated, and transmitted by computers.
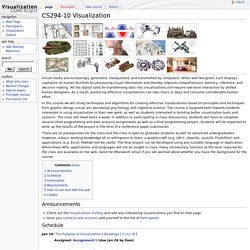
When well designed, such displays capitalize on human facilities for processing visual information and thereby improve comprehension, memory, inference, and decision making. Yet the digital tools for transforming data into visualizations still require low-level interaction by skilled human designers. As a result, producing effective visualizations can take hours or days and consume considerable human effort. In this course we will study techniques and algorithms for creating effective visualizations based on principles and techniques from graphic design, visual art, perceptual psychology and cognitive science.
The health hazards of sitting. Visualizing Trouble. Many technologies and forms of communication experience a painful, necessary moment.
Synthesizers endured A Flock of Seagulls. The internet had its GeoCities moment. Visual Representation. .
Unfortunately, world class educational materials are normally hidden behind payment systems or in expensive textbooks. If you want this to change, you should . As such, these copyright terms are designed for the author and the reader, not the publisher and the profit. The Ultimate Guide to Biking and Cycling [INFOGRAPHIC] Infographics & Data Visualization. What Makes a Good Infographic? Tech hotshots: The rise of the dataviz expert - Network World. Computerworld - A picture's worth a million data points.
That's the mantra, anyway, in business analytics these days. As the big data trend intensifies and analytics become more ingrained in corporations, the need for people who can present data in easily intelligible ways is rising. Iramuteq — IRaMuTeQ. Infographie100PersonnesGrand.jpg (2779×2772) Software: Visualization and Data Mining. The Art of Data Visualization: How to Tell Complex Stories Through Smart Design.
The volume of data in our age is so vast that whole new research fields have blossomed to develop better and more efficient ways of presenting and organizing information.
One such field is data visualization, which can be translated in plain English as visual representations of information. The PBS “Off Book” series turned its attention to data visualization in a short video featuring Edward Tufte, a statistician and professor emeritus at Yale, along with three young designers on the frontiers of data visualization. Titled “The Art of Data Visualization,” the video does a good job of demonstrating how good design—from scientific visualization to pop infographics—is more important than ever. In much the same way that Marshall McLuhan spoke about principles of communication, Tufte talks in the video about what makes for elegant and effective design.